Four-Layer Broadband AR Cross-Validation
This validation uses Essential Macleod, an established professional thin-film design package, as an independent reference for a four-layer MgF₂/ZrO₂ broadband anti-reflection coating. It performs two comparisons: normal-incidence reflectance from 400 to 700 nm for an identical tuned structure, and independent optimization of four physical thicknesses from the same ideal optical-thickness design. The forward spectra overlap across the full band. The optimized thicknesses have a mean relative difference of 0.36% and a maximum difference of 0.782%.
Validation Target and Acceptance Criteria
QHQ (Quarter-Half-Quarter) is a classical broadband anti-reflection design. A conventional QHQ stack requires an intermediate-index material. The four-layer form replaces that layer with an equivalent pair made from the existing high- and low-index materials, reducing the material set and then using gentle refinement to obtain broadband low reflectance.
| Item | Controlled conditions | Acceptance criterion |
|---|---|---|
| Forward calculation of the tuned design | Identical dispersion, layer order, thicknesses, surrounding media, wavelengths, and incidence | Matching extrema, line shape, and in-band reflectance |
| Forward calculation of the ideal starting design | 510 nm reference wavelength; FWOT values of 0.25, 0.5, 0.0625, and 0.0625 | Overlapping starting spectra |
| Four-variable thickness optimization | Identical band, target quantity, incidence, and variable bounds | Less than 1% relative difference for every optimized layer |
The model is a one-dimensional planar multilayer made of linear isotropic materials, placing it within the standard scope of the transfer-matrix method.
Shared Materials and Boundary Conditions
Light enters from air and passes through MgF₂, ZrO₂, MgF₂, and ZrO₂ before reaching a glass substrate. Both programs import the same wavelength-dependent n, k data, removing material-database revisions and source interpolation as comparison variables.
| Material | Validation data |
|---|---|
| MgF₂ | Download MgF2.txt |
| ZrO₂ | Download ZrO2.txt |
| Glass substrate | Download Glass.txt |
The shared forward-calculation setup is 400–700 nm with a 5 nm step, 0° incidence, and a polarization ratio of 0.5. Optimization uses the same band with a finer 1 nm step to reduce sampling sensitivity in the band-average objective.
Forward Calculation of the Tuned Design
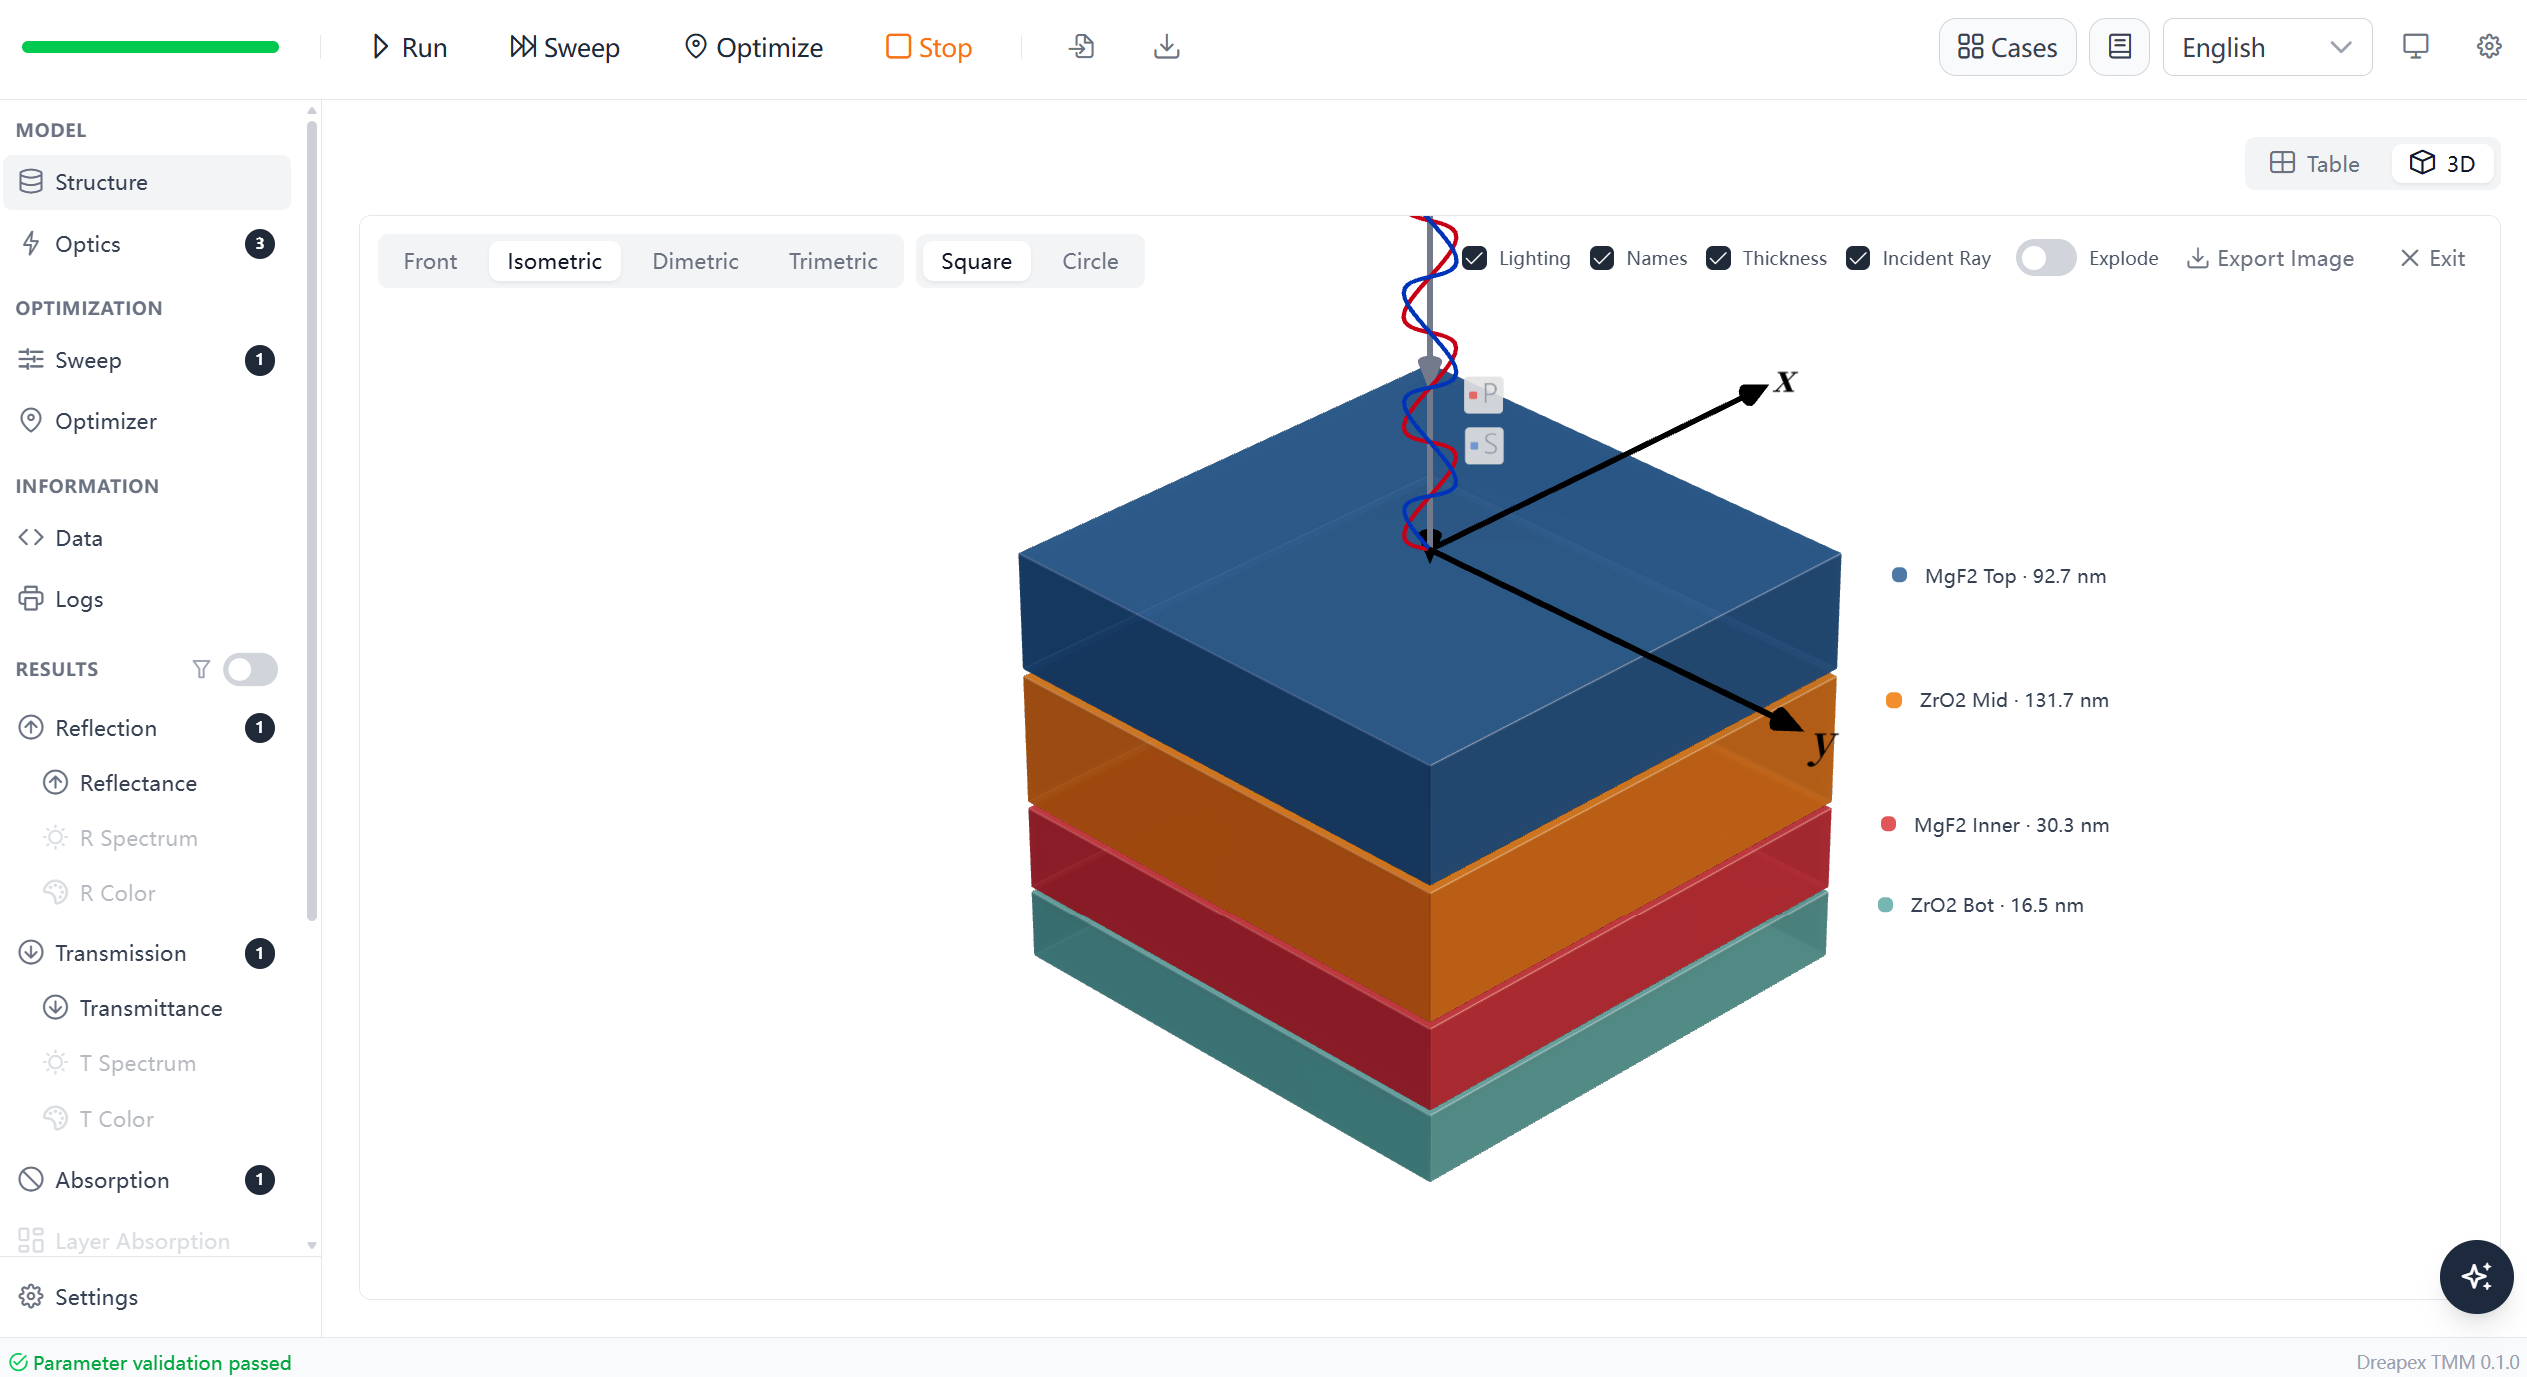
Dreapex TMM Structure
The four layers follow the MgF₂/ZrO₂/MgF₂/ZrO₂ order. The thicknesses used for this first forward comparison were previously tuned and are not strict quarter-wave or half-wave values.

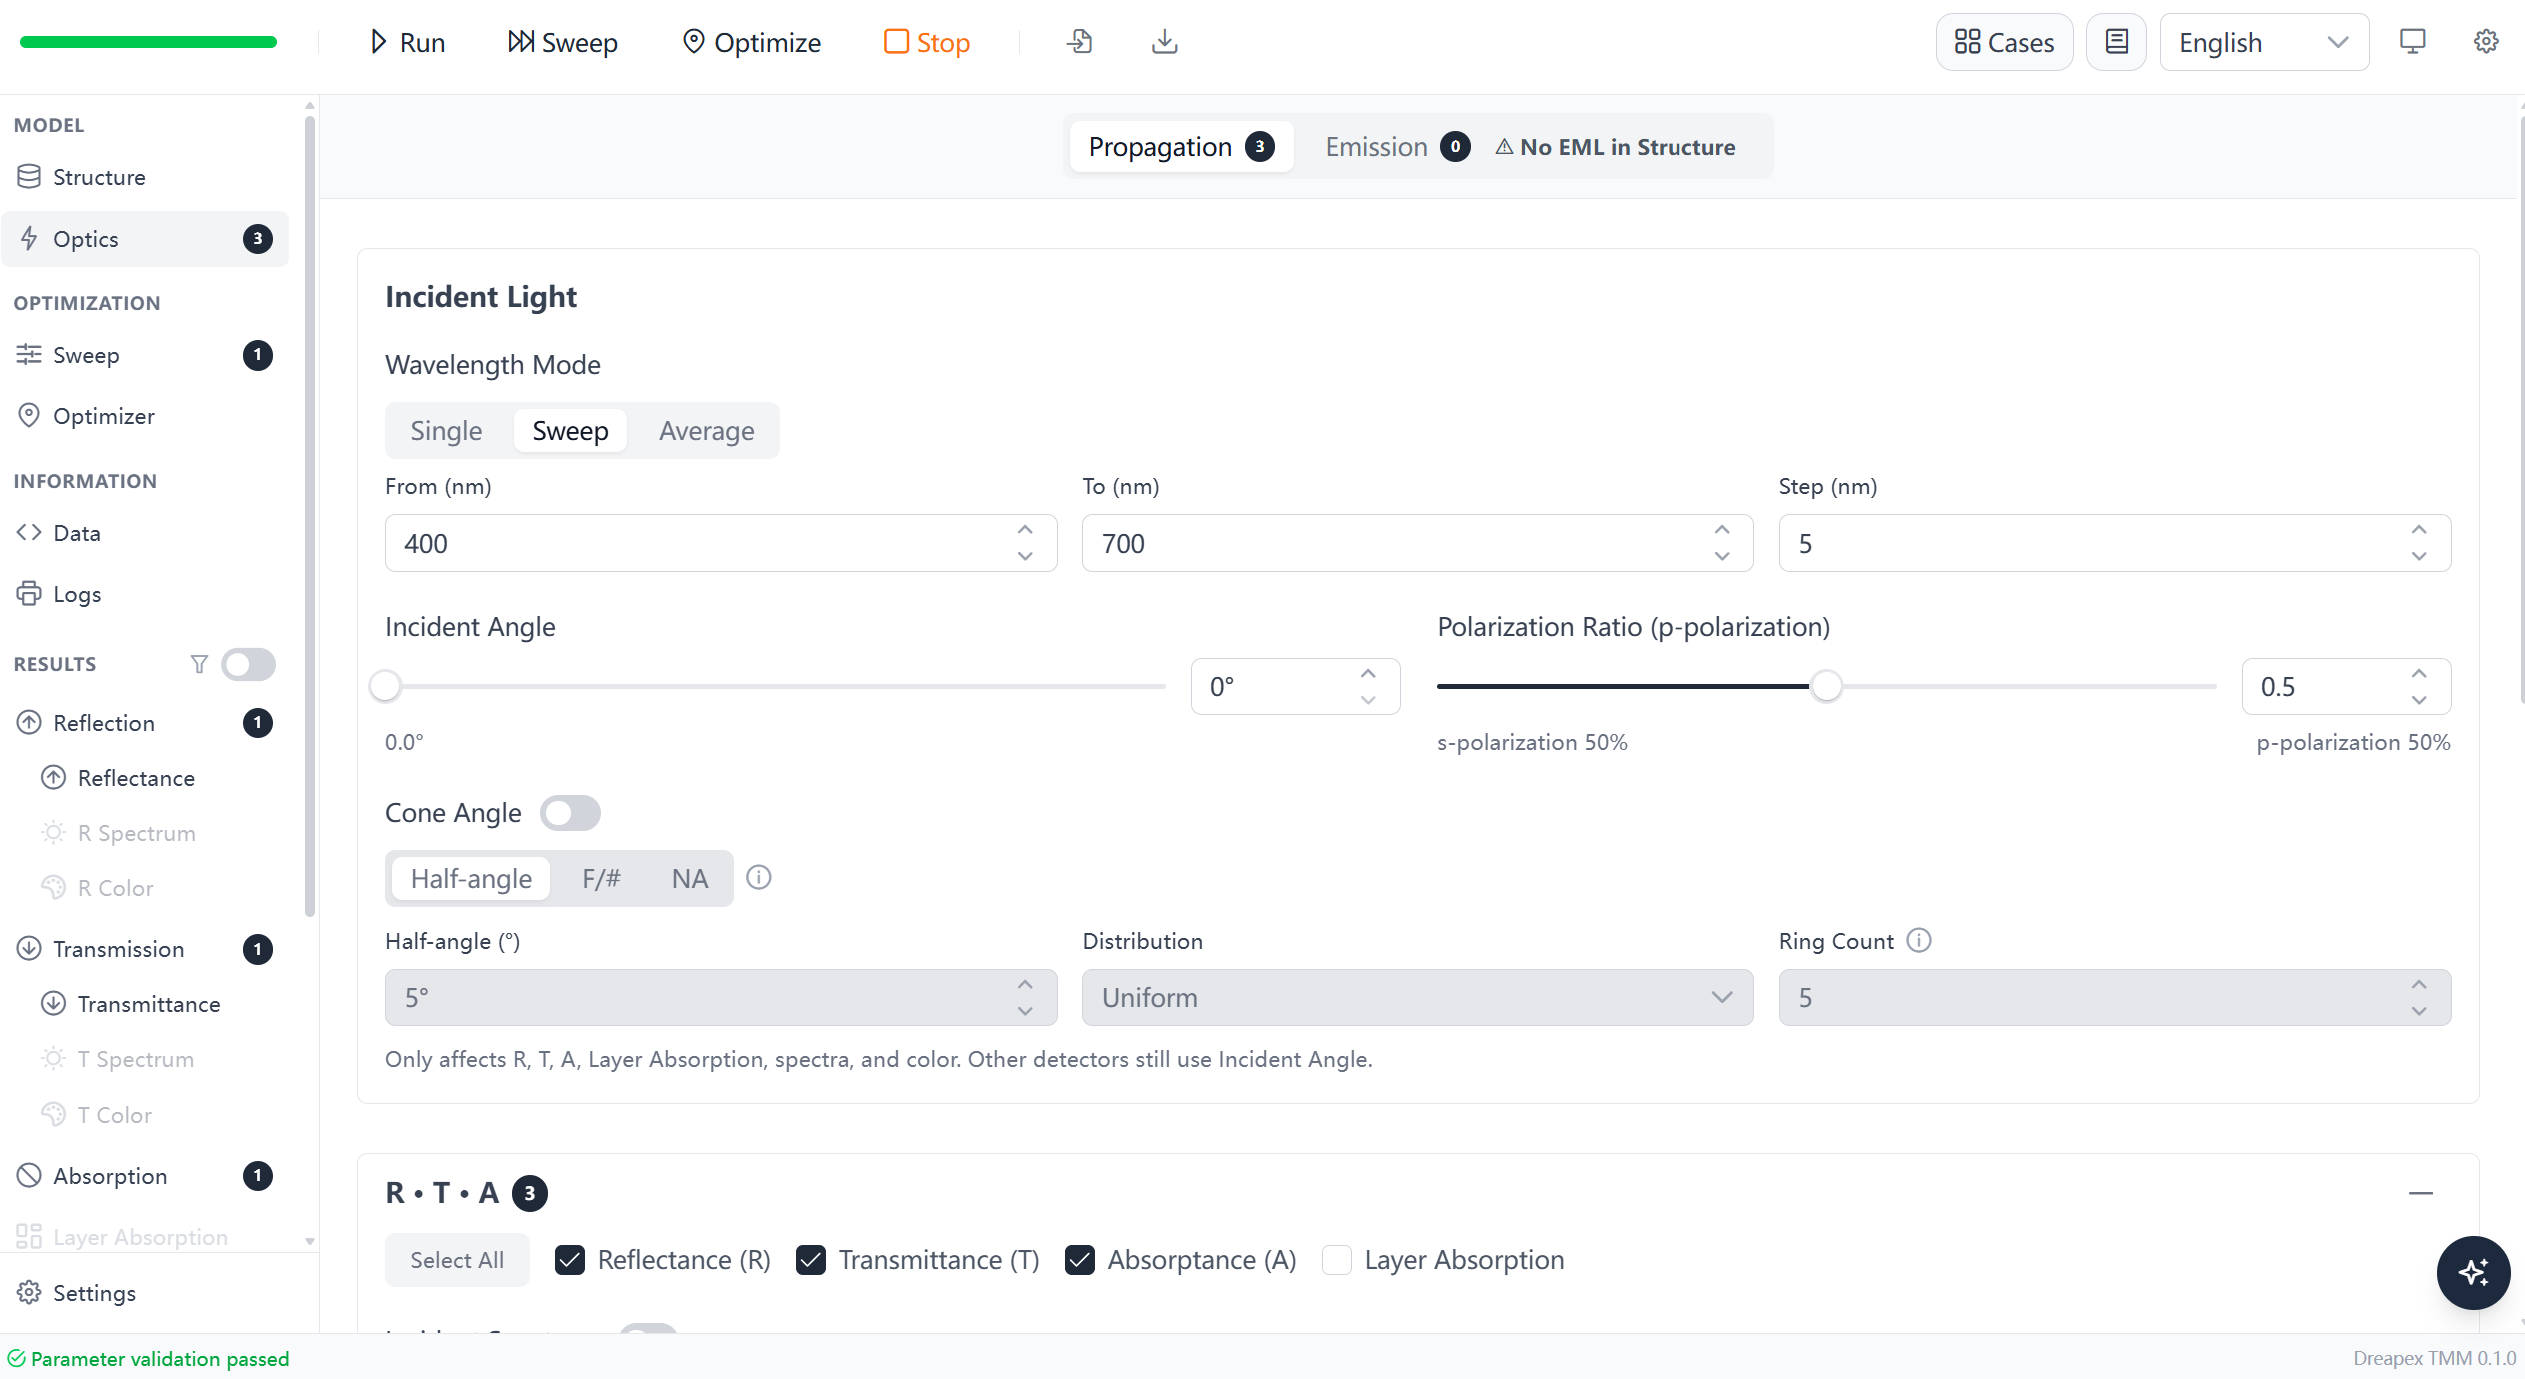
The Optics page uses Sweep wavelength mode from 400 to 700 nm with a 5 nm step at normal incidence.
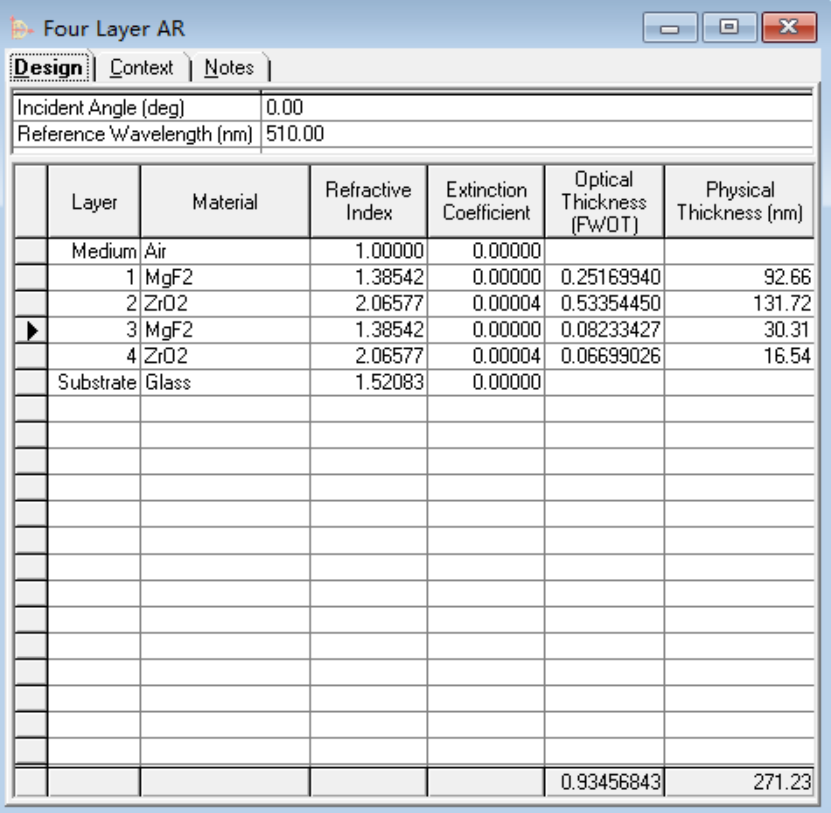
Essential Macleod Structure
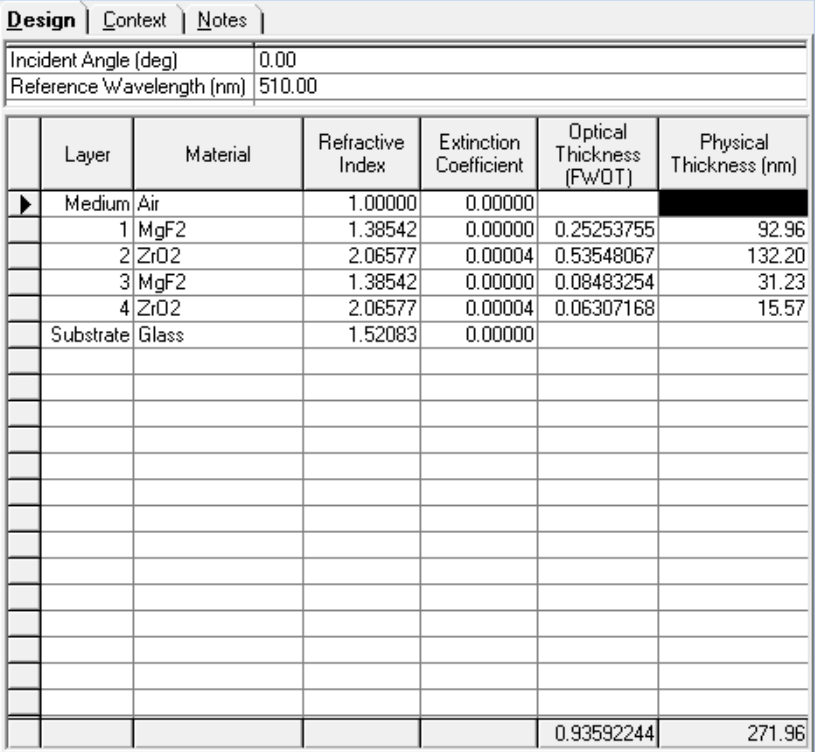
The independent reference uses the same materials, order, and physical thicknesses. Its design table also lists fractional-wave optical thickness (FWOT) at the 510 nm reference wavelength, showing that the tuned values differ from the ideal 0.25, 0.5, 0.0625, and 0.0625 sequence.
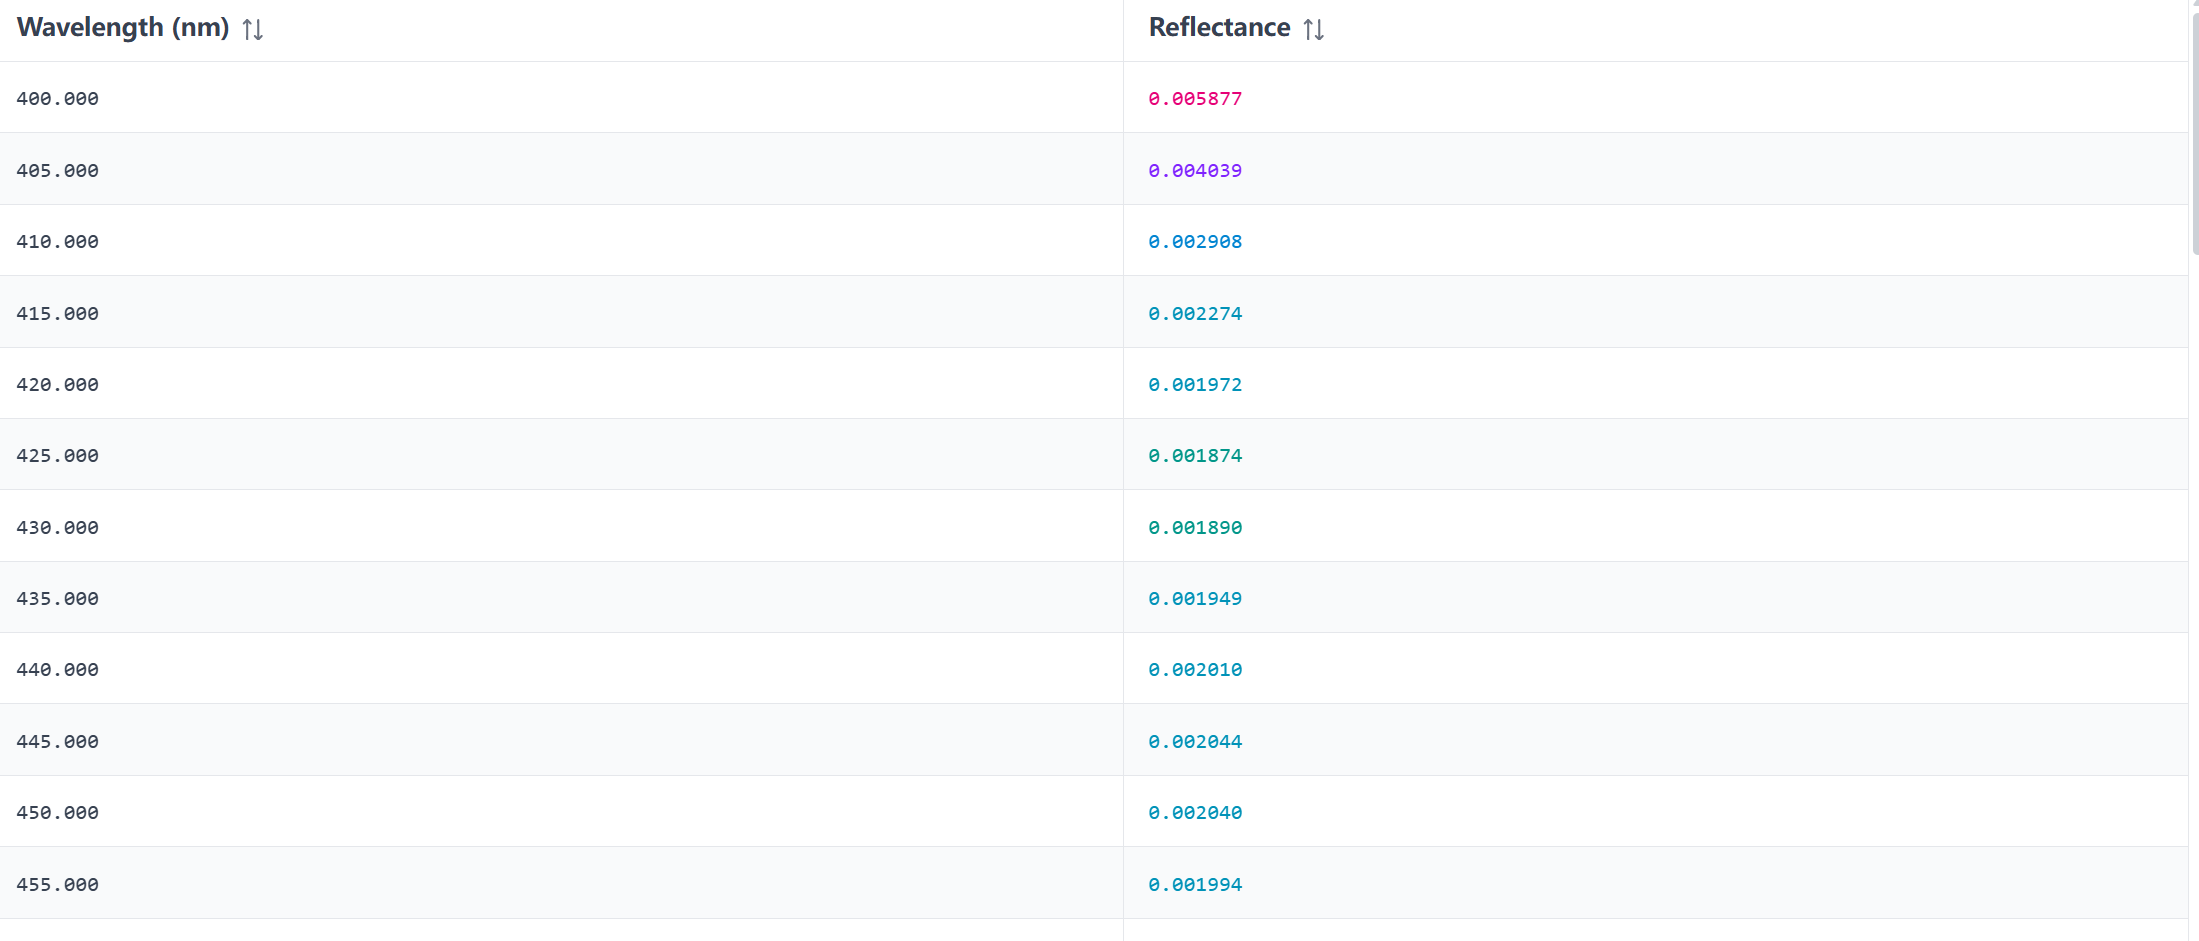
Original Outputs and Overlay
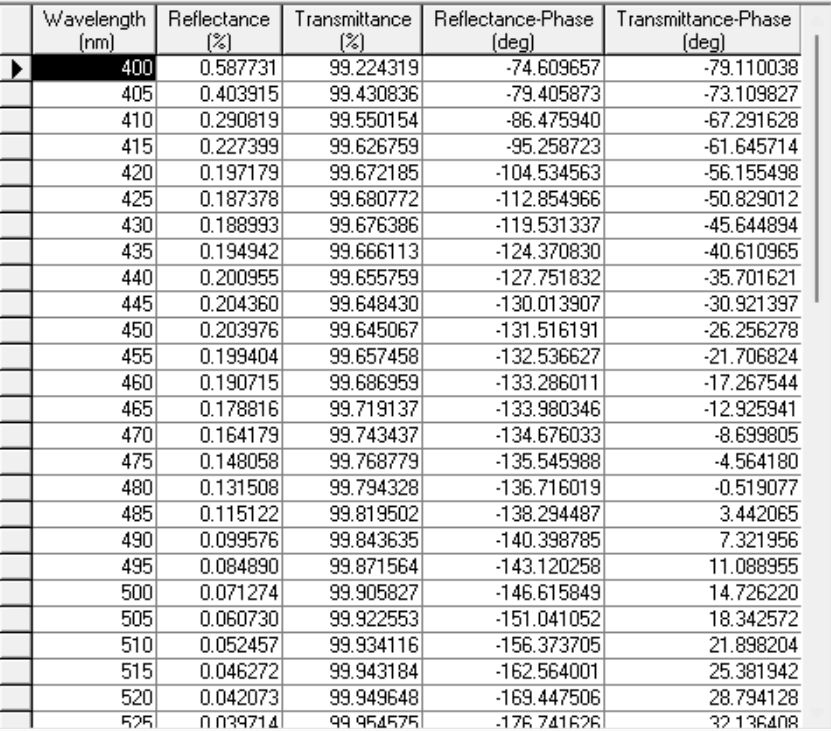
Dreapex TMM reports reflectance, transmittance, and phase values for all 61 sampled wavelengths.
Essential Macleod reports the corresponding reflectance data for the same structure.
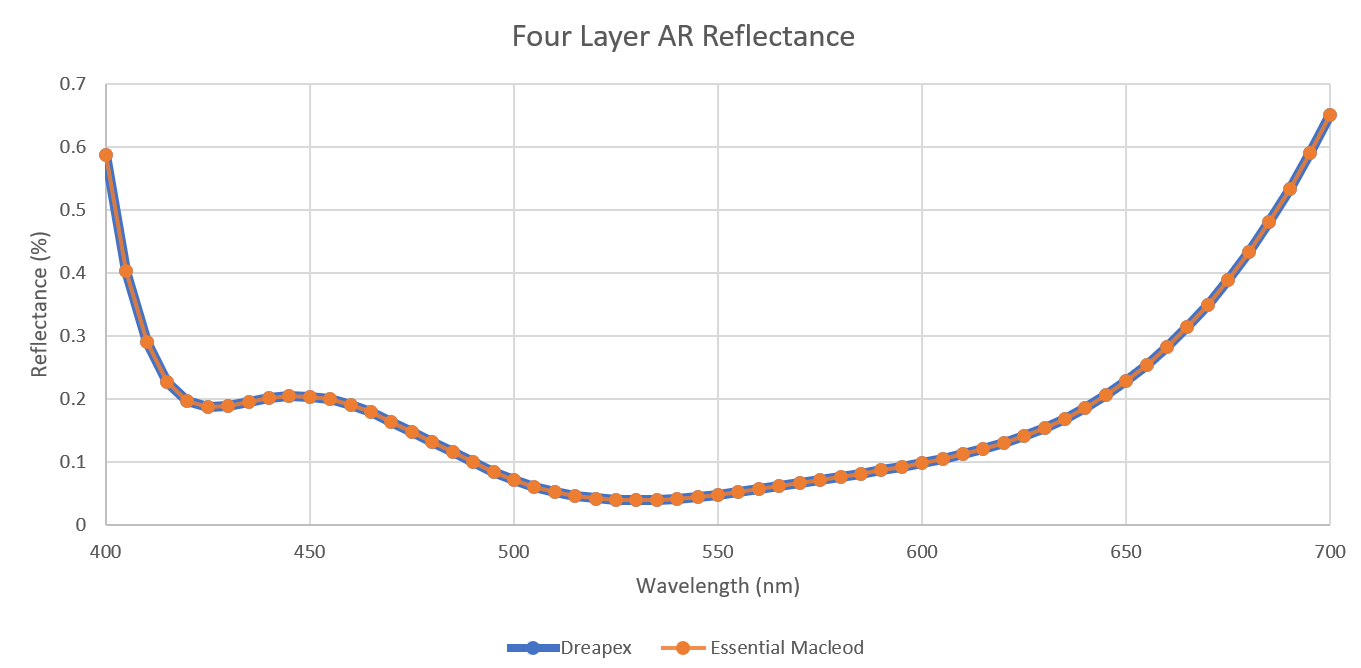
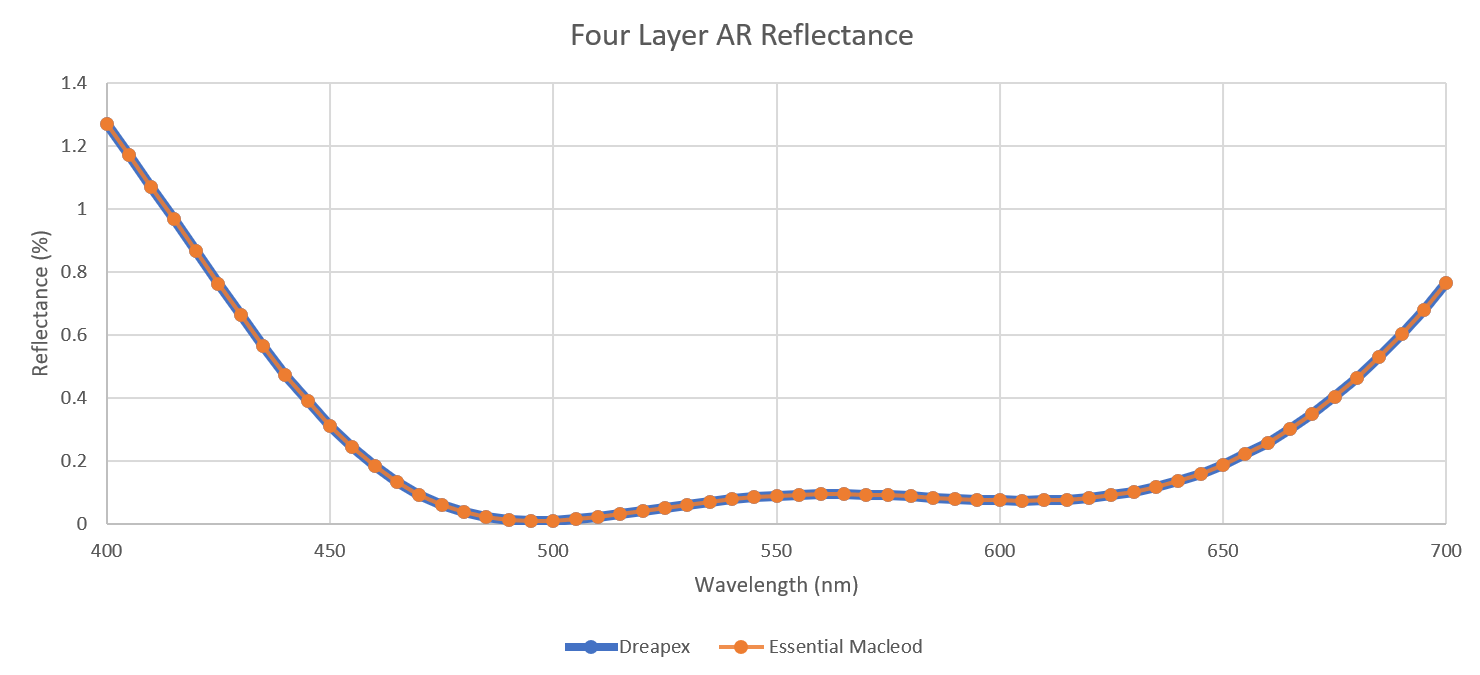
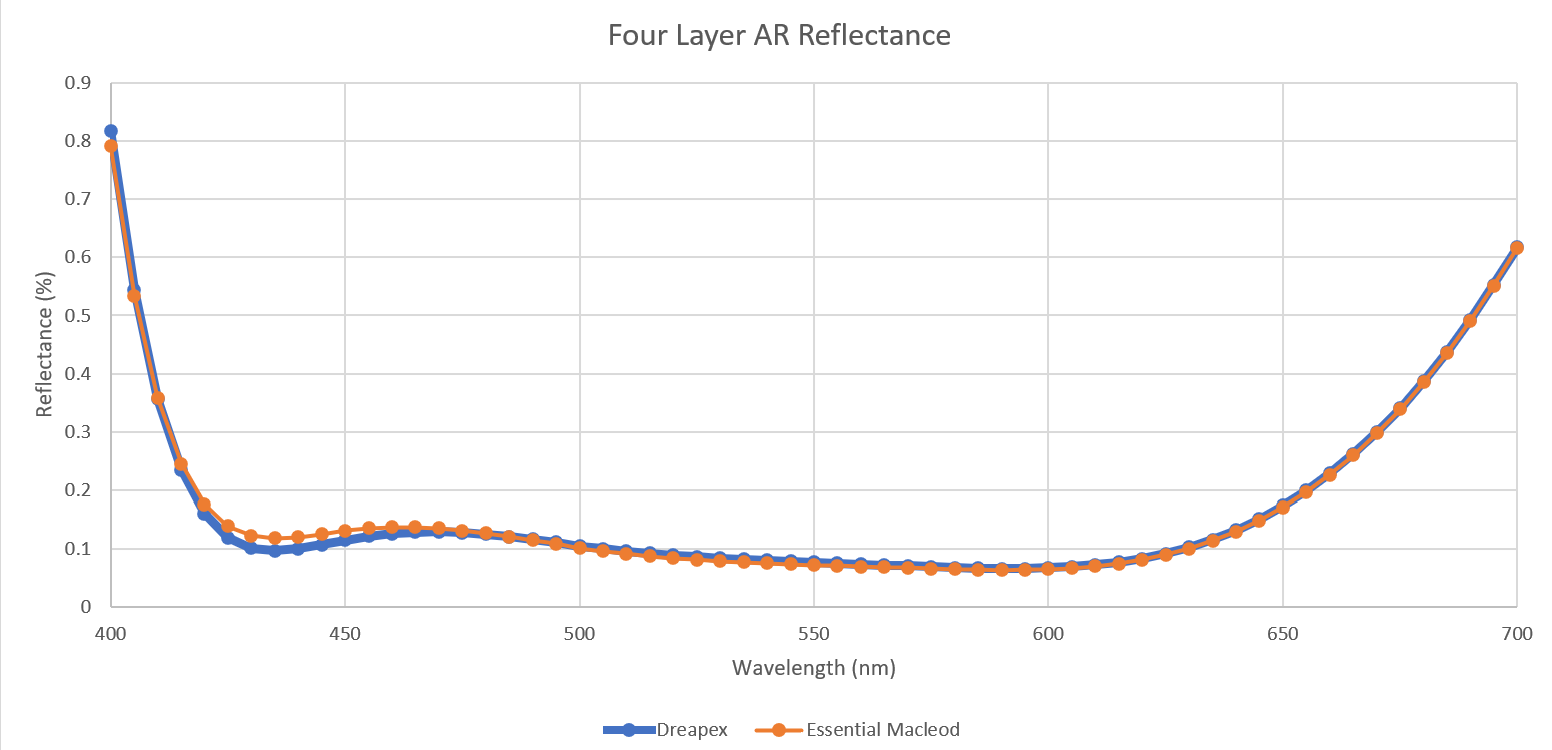
When plotted on the same axes, the two reflectance data sets overlap across 400–700 nm. Both show a rapid short-wavelength decrease, a shallow feature around 430–460 nm, a low-reflectance central region, and a gradual rise beyond approximately 620 nm. No visible shift appears in the extrema or principal turning points.
Re-optimization from Ideal Optical Thicknesses
The second validation does not reuse the tuned thicknesses. Both programs start at a 510 nm reference wavelength and convert FWOT values of 0.25, 0.5, 0.0625, and 0.0625 into the same four physical thicknesses using the shared material indices.
| Position | Material | Starting thickness | Optimization range |
|---|---|---|---|
| Top layer | MgF₂ | 92.03 nm | 90–100 nm |
| Second layer | ZrO₂ | 123.44 nm | 110–135 nm |
| Third layer | MgF₂ | 23.93 nm | 20–35 nm |
| Bottom layer | ZrO₂ | 16.05 nm | 10–20 nm |
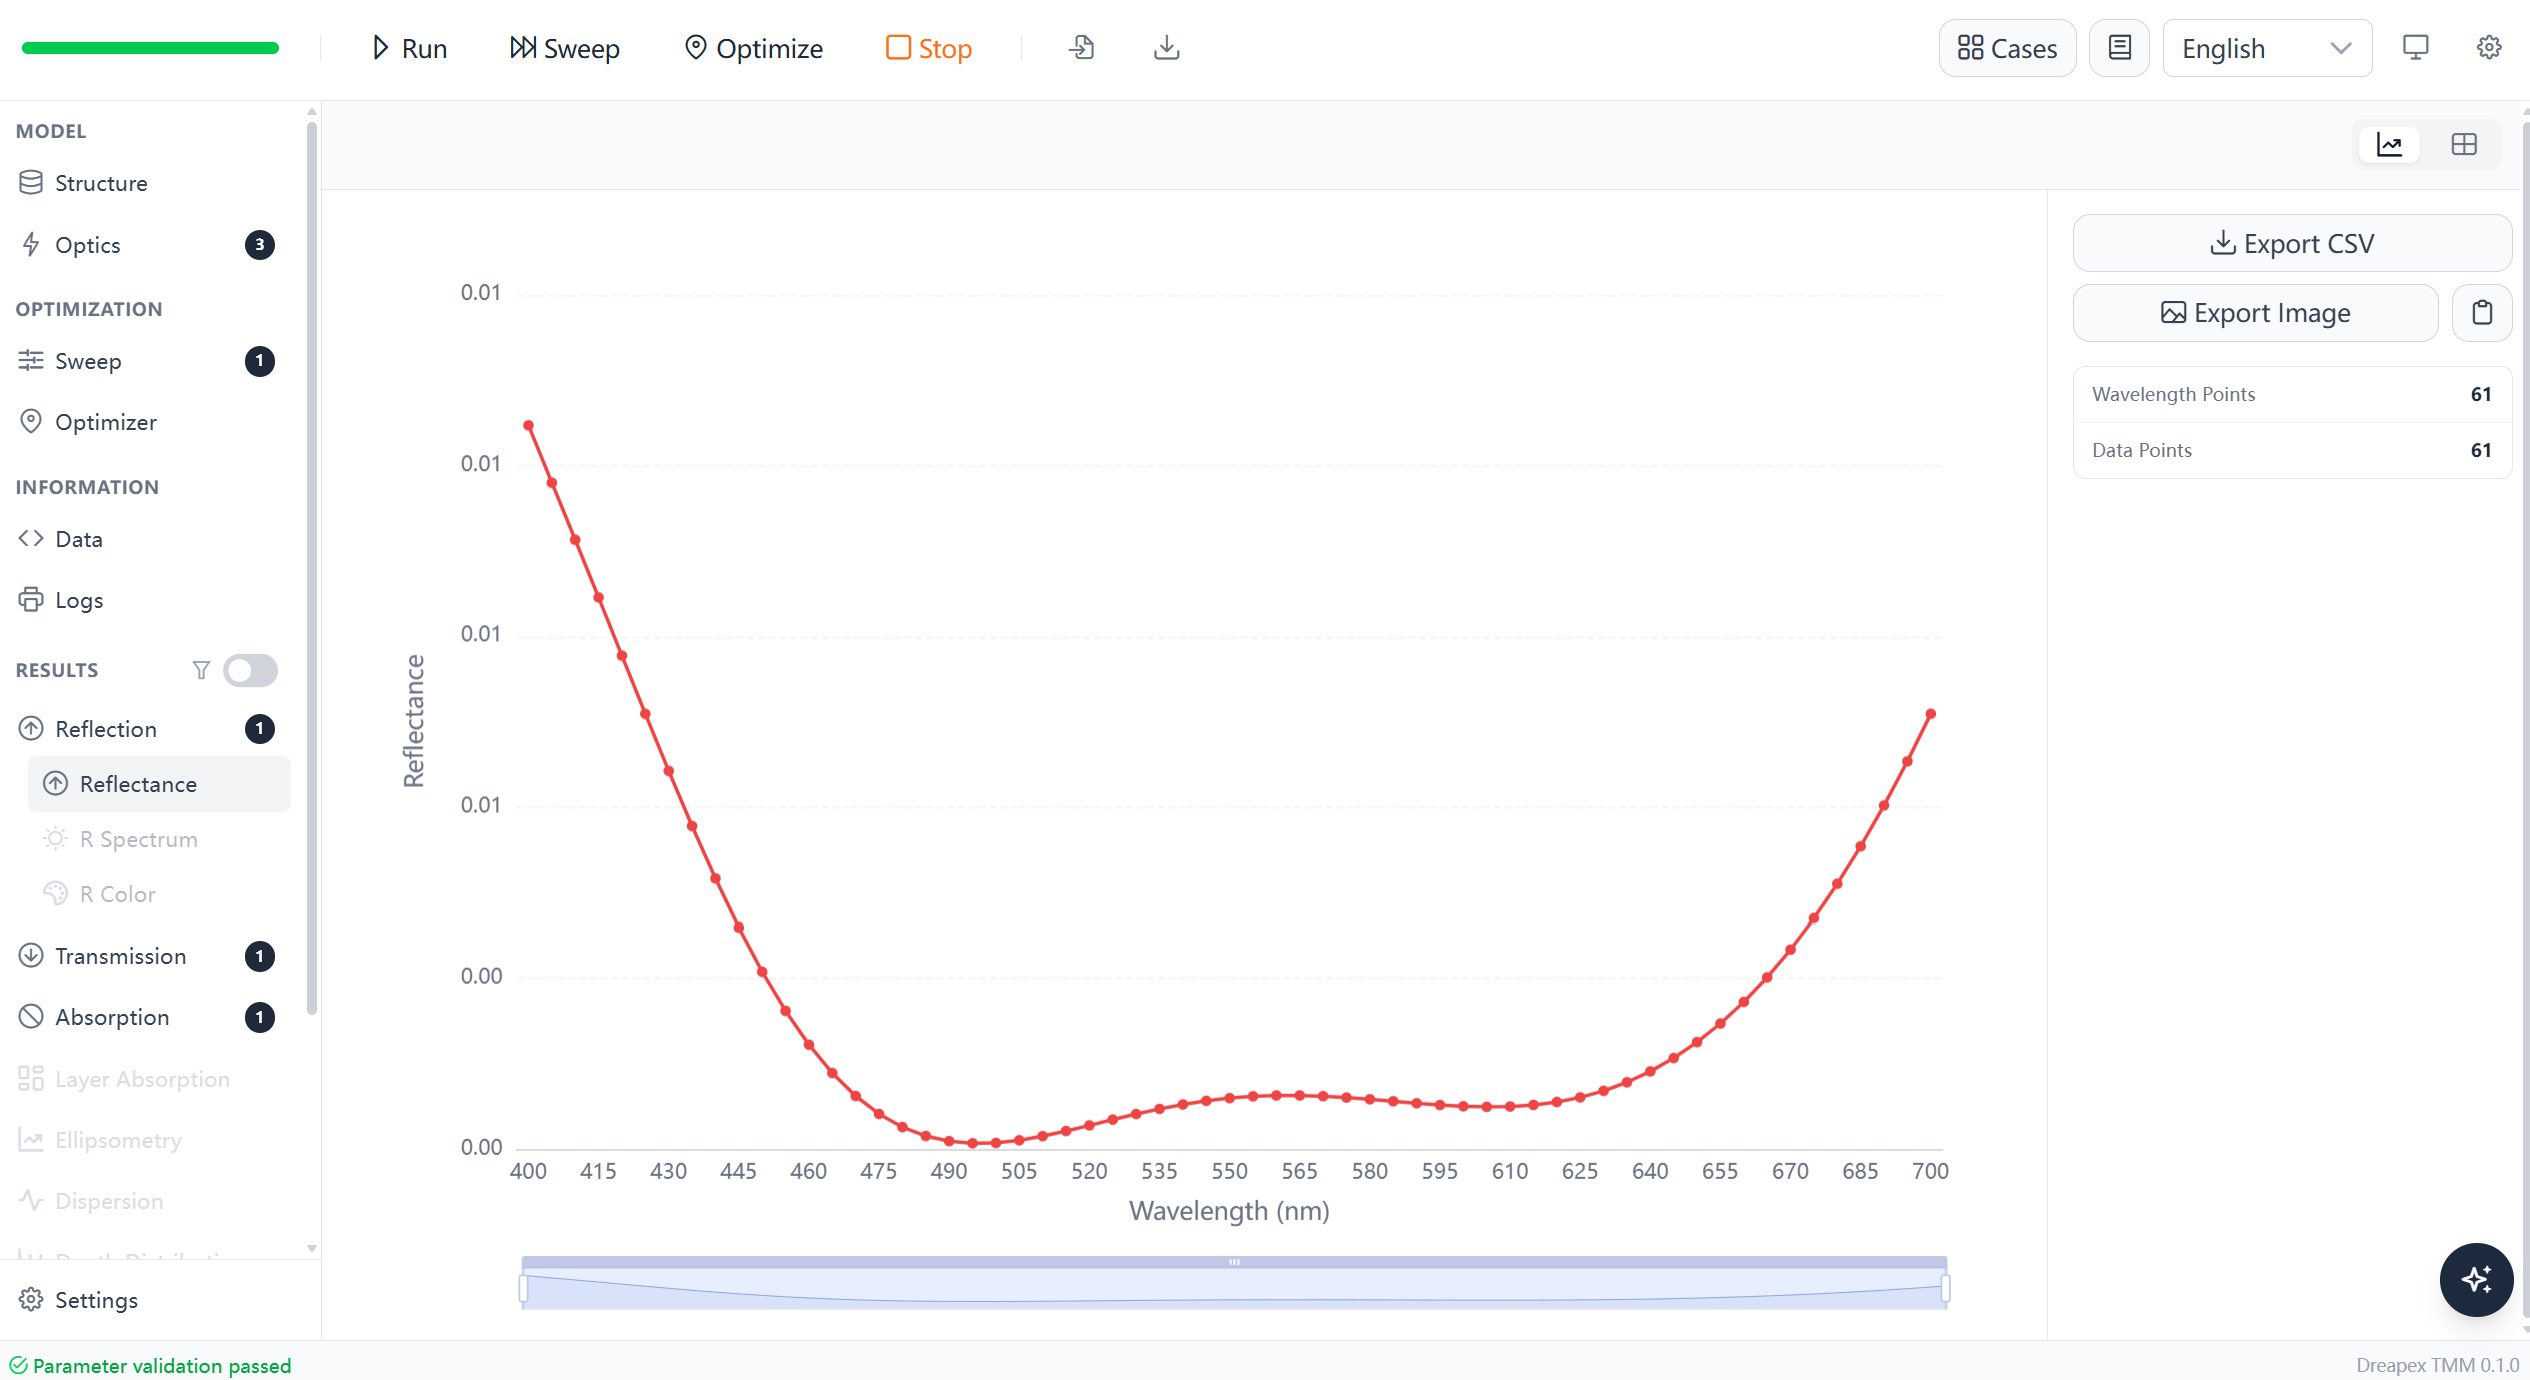
Dreapex TMM Starting Design and Reflectance

Essential Macleod Starting Design and Reflectance
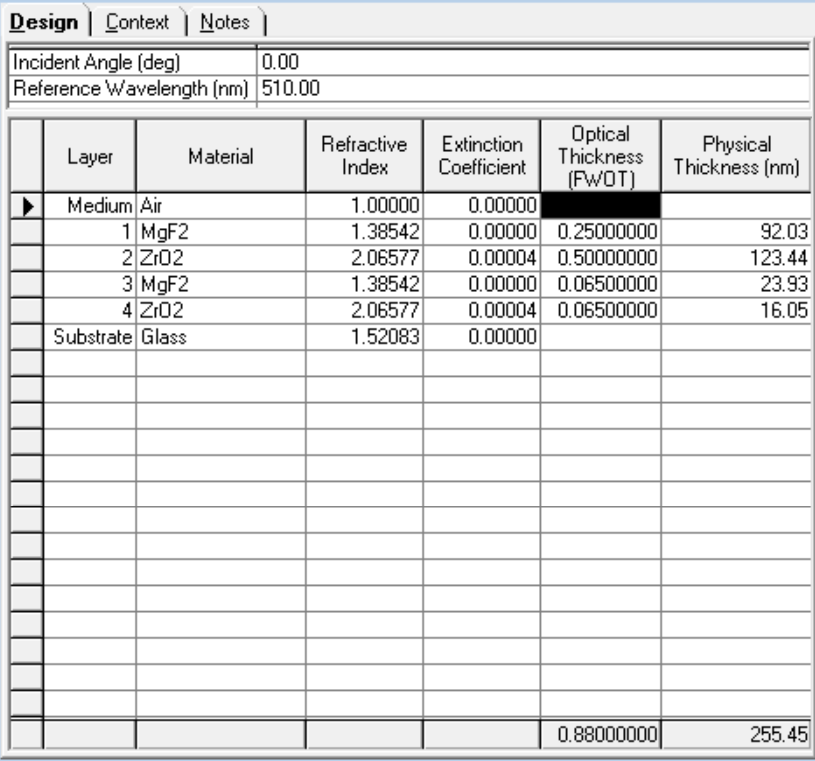
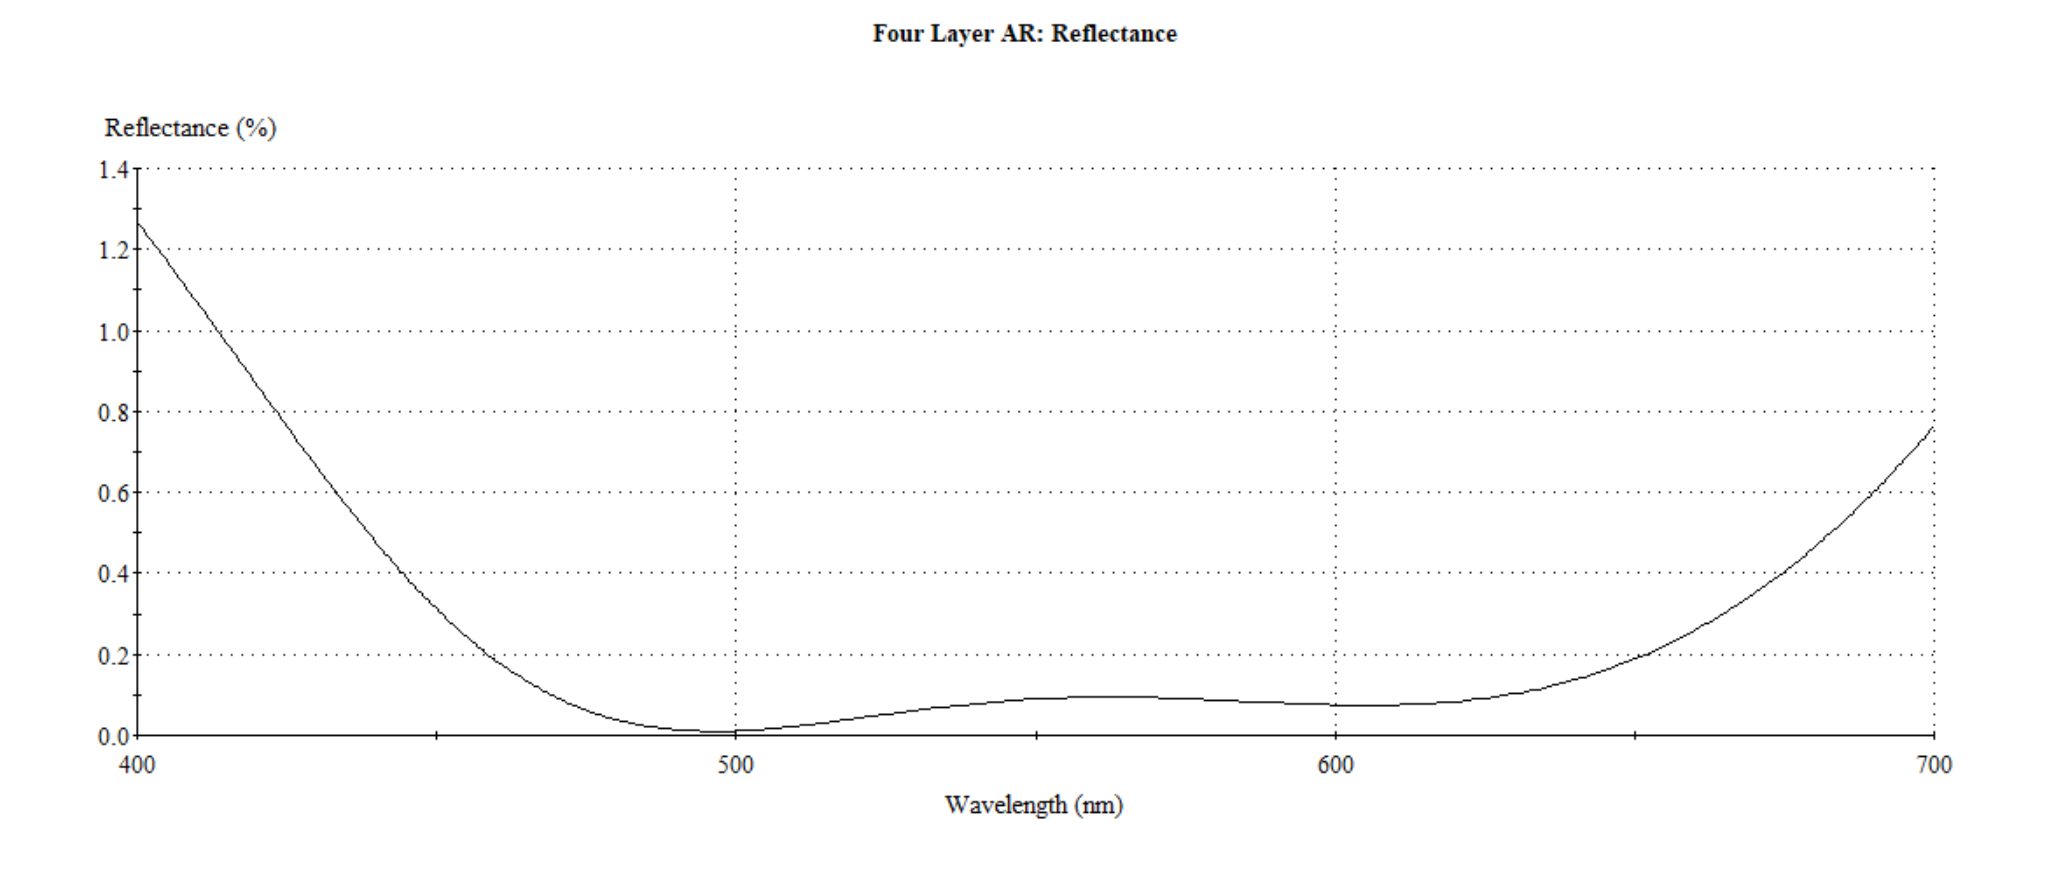
The two starting curves overlap, confirming that both optimizations begin from the same optical state.
Dreapex TMM Optimization
Objective
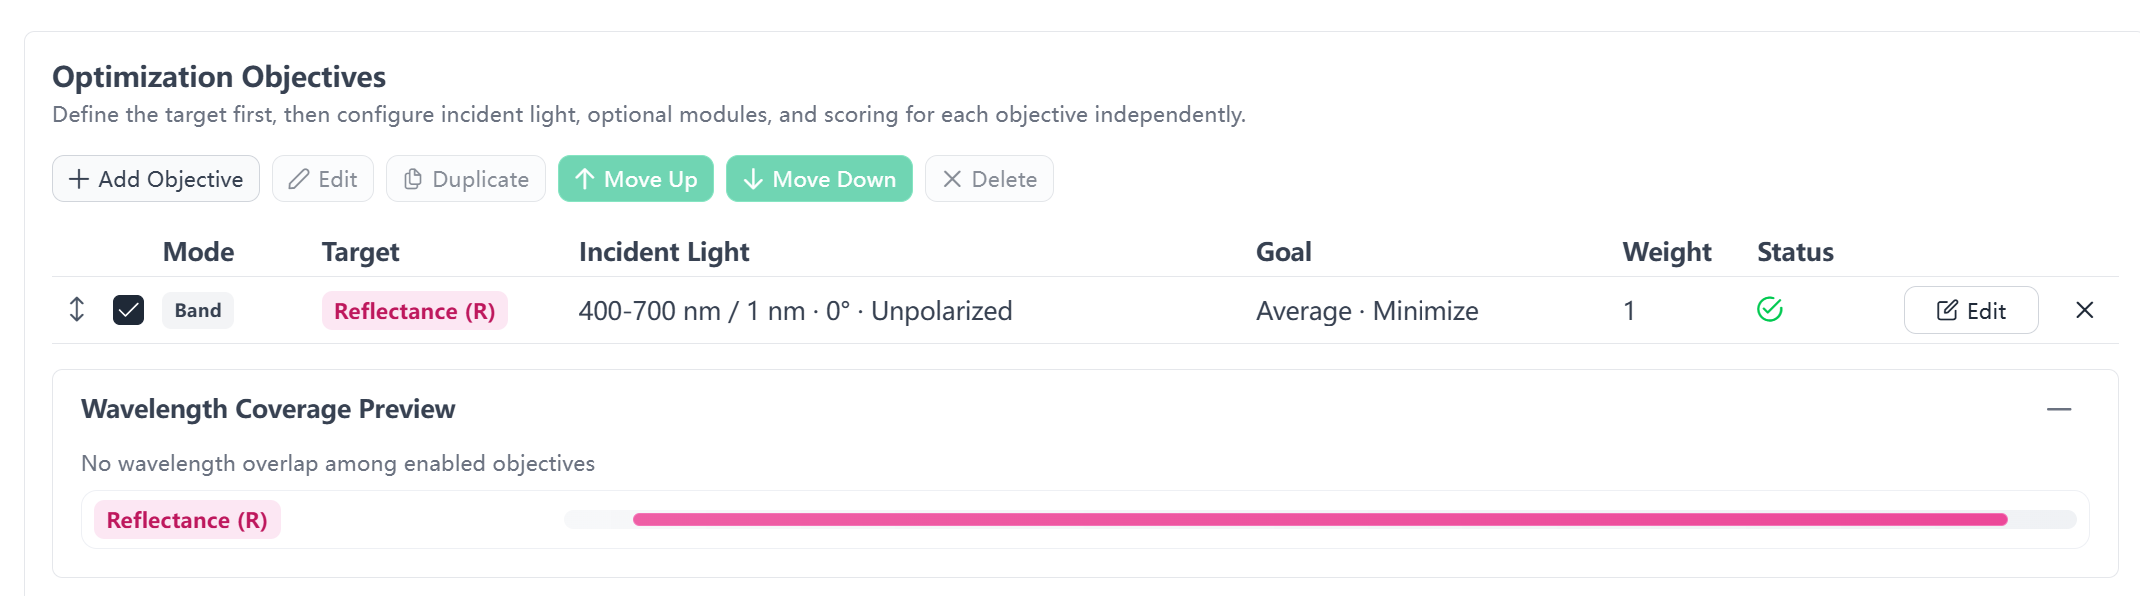
The objective minimizes average reflectance from 400 to 700 nm. The target is Reflectance (R), the mode is Band, the direction is Minimize, the incidence angle is 0°, the polarization ratio is 0.5, and the weight is 1.
Variables, Grid Search, and Local Algorithm
All four physical thicknesses are optimization variables. The grid pre-search uses 5 samples per variable, evaluates 625 combinations, and passes 3 candidate points to local refinement.
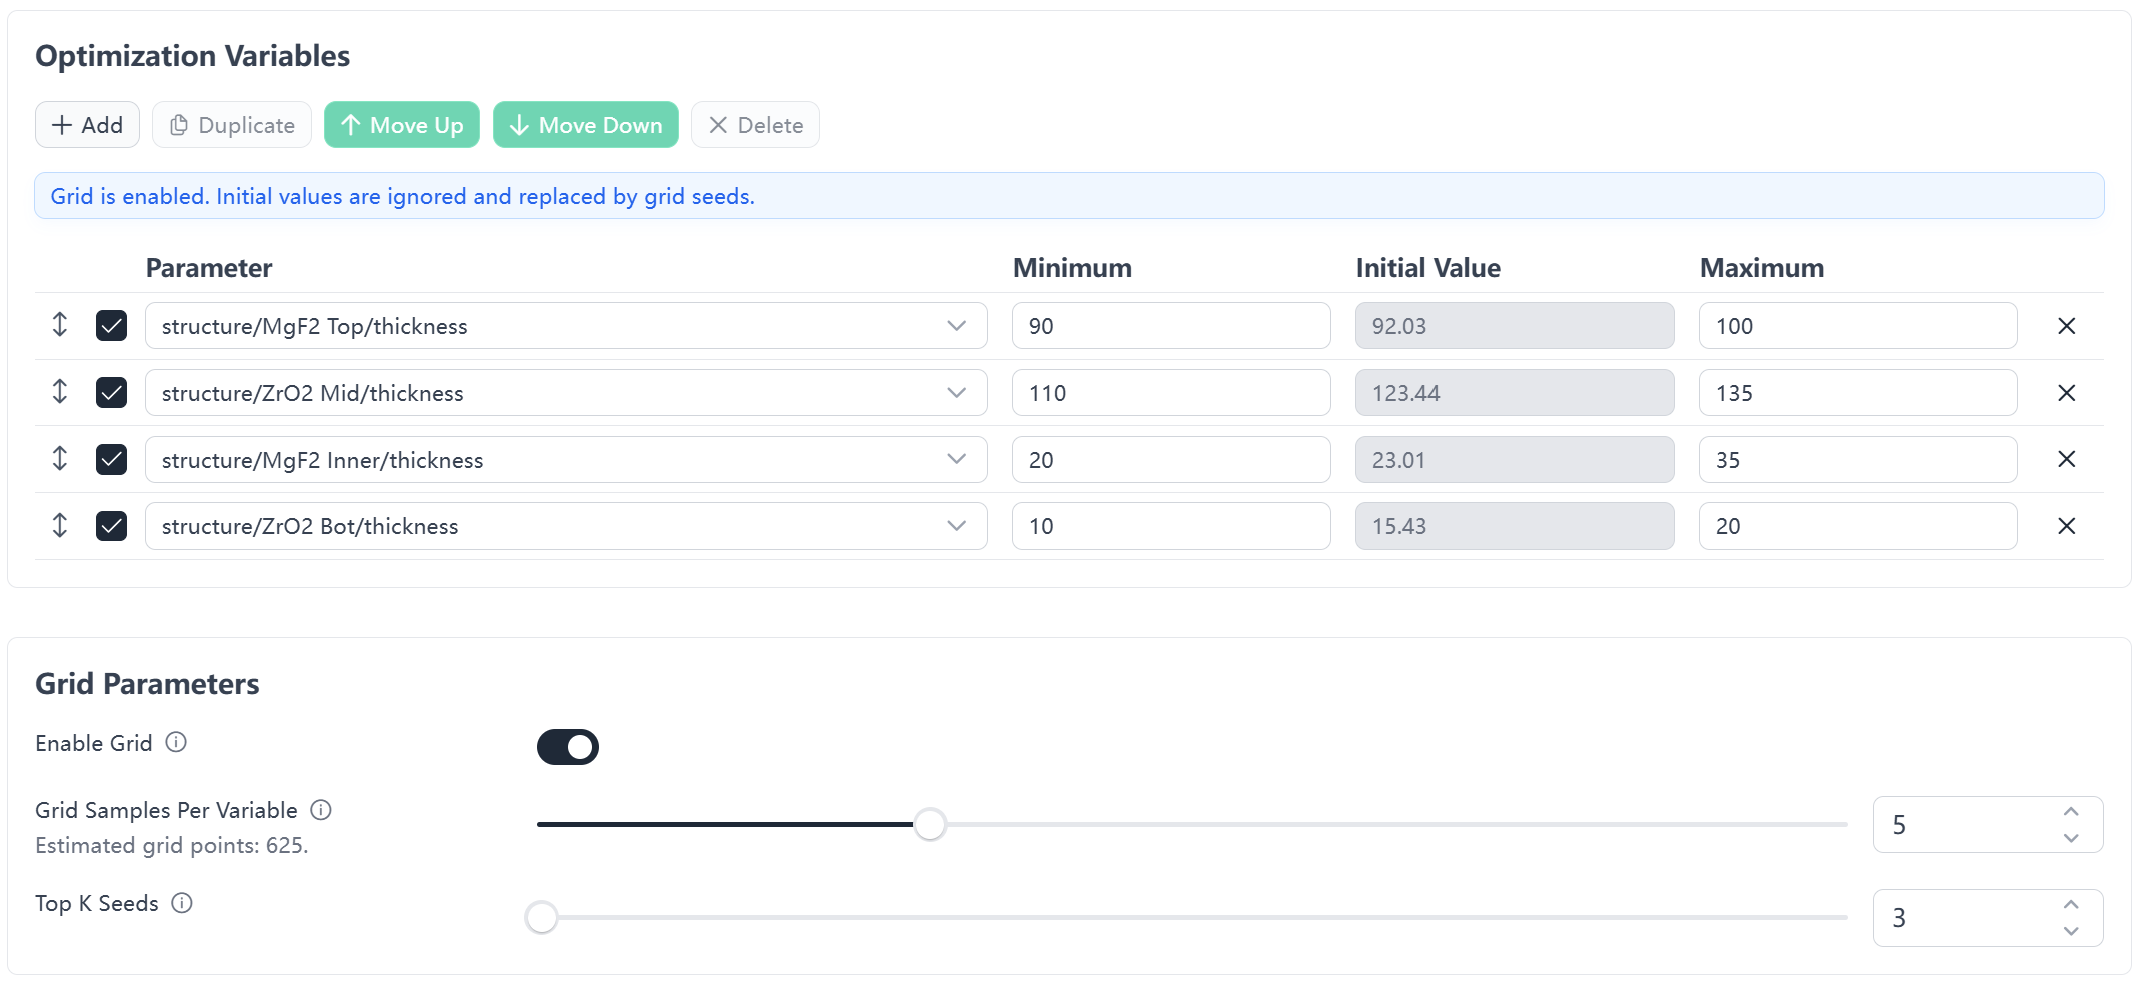
Local refinement uses TRF with a maximum of 50 evaluations per candidate.
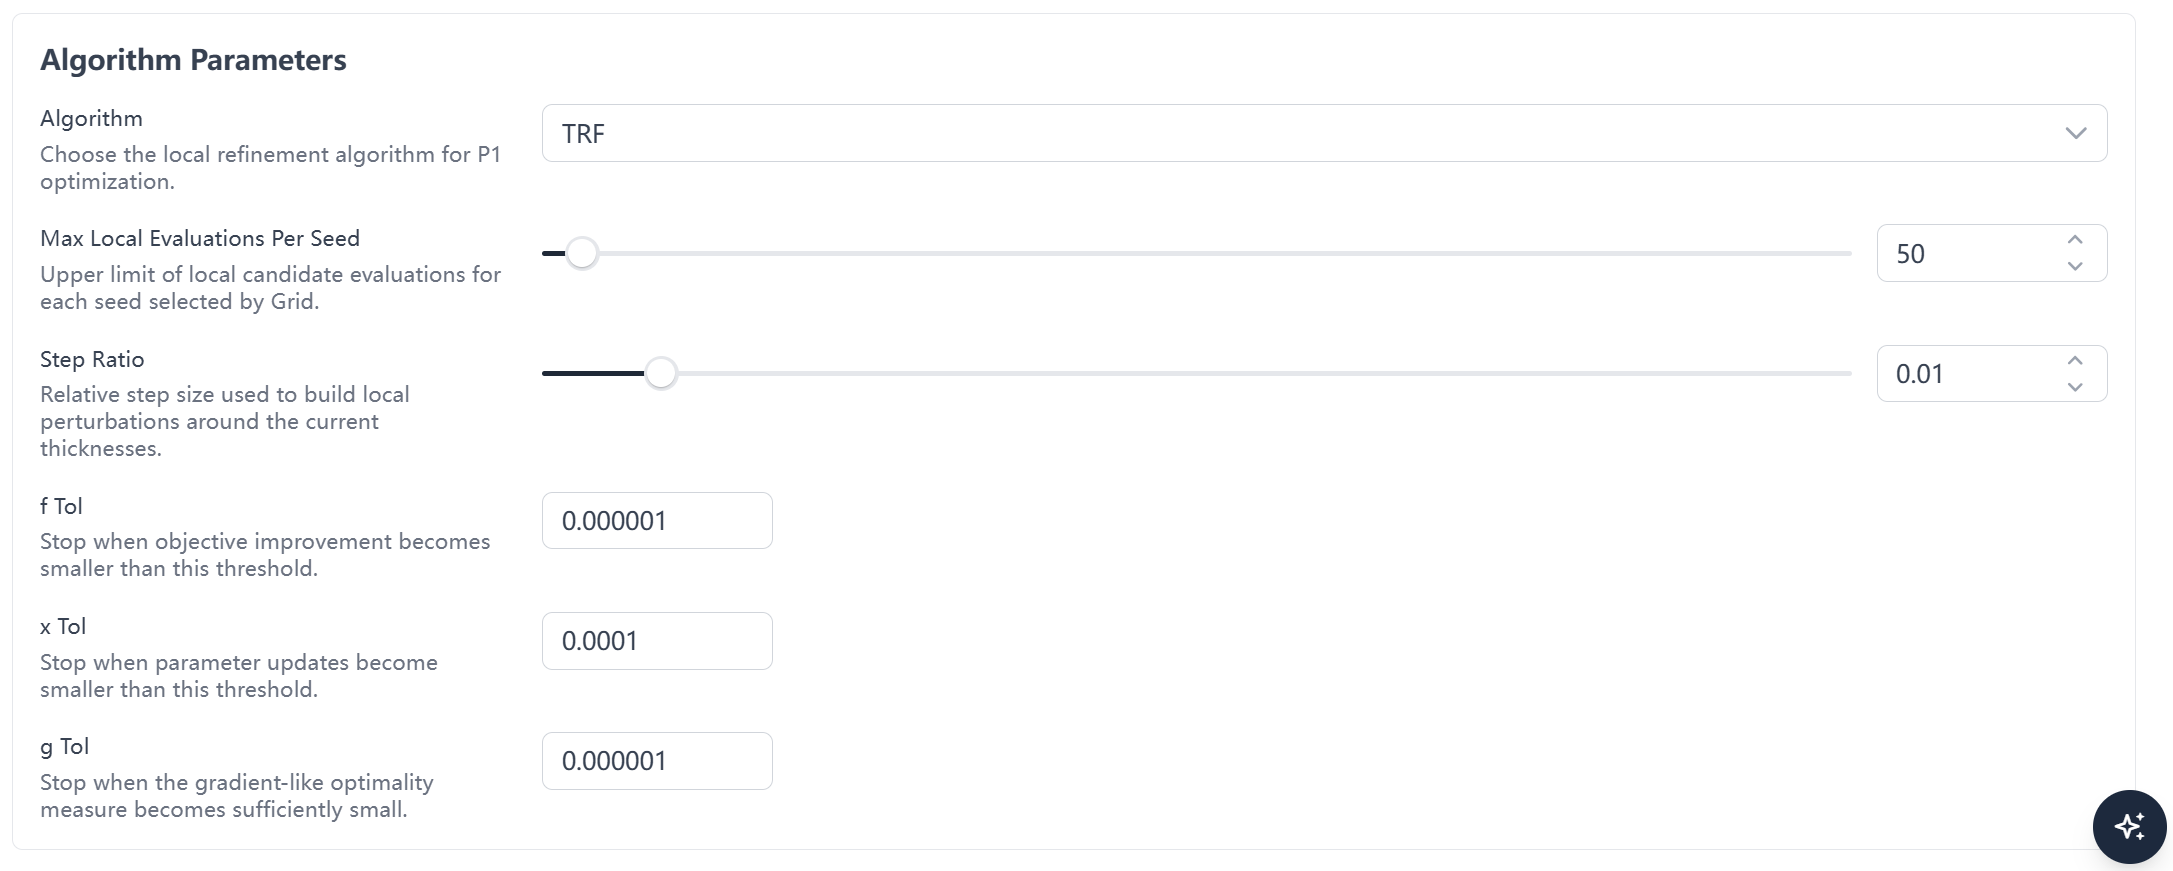
| Setting | Value |
|---|---|
| Mode | Band |
| Target | Reflectance (R) |
| Direction | Minimize |
| Wavelength | 400–700 nm, 1 nm step |
| Incidence | 0°, unpolarized |
| Variables | Four physical layer thicknesses |
| Grid sampling | 5 points per variable, 625 combinations |
| Local candidates | 3 |
| Local algorithm | TRF |
| Maximum evaluations per candidate | 50 |
Report and Structure Check
The optimization report records the best objective value, execution time, evaluation count, algorithm, and grid pre-search summary.
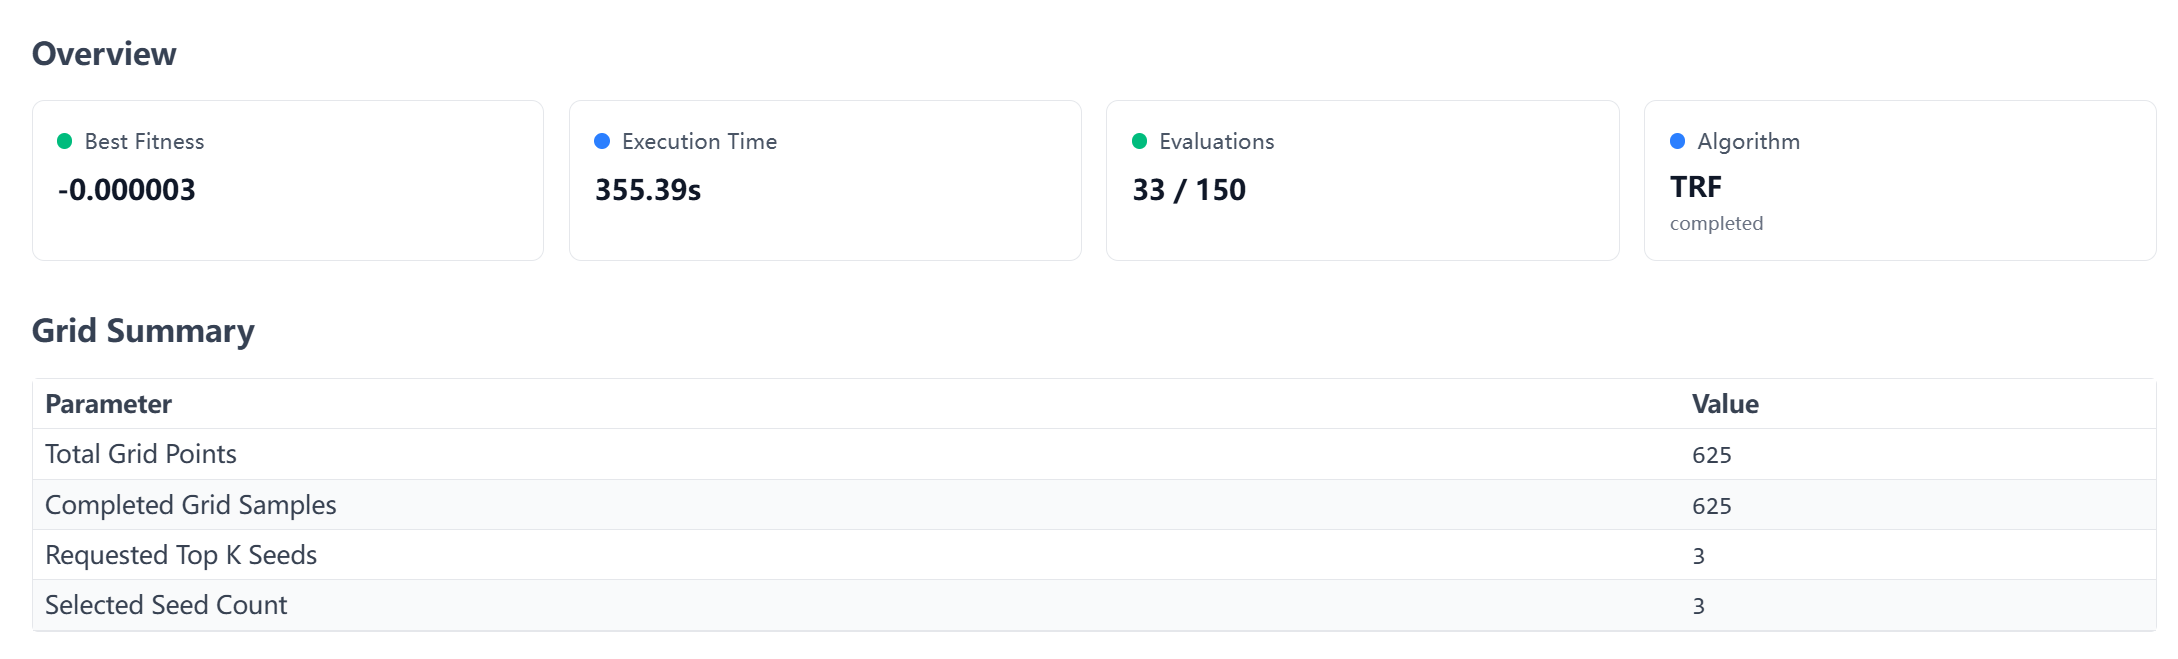
All three candidates complete local refinement, and the best-solution region lists the final four thicknesses.
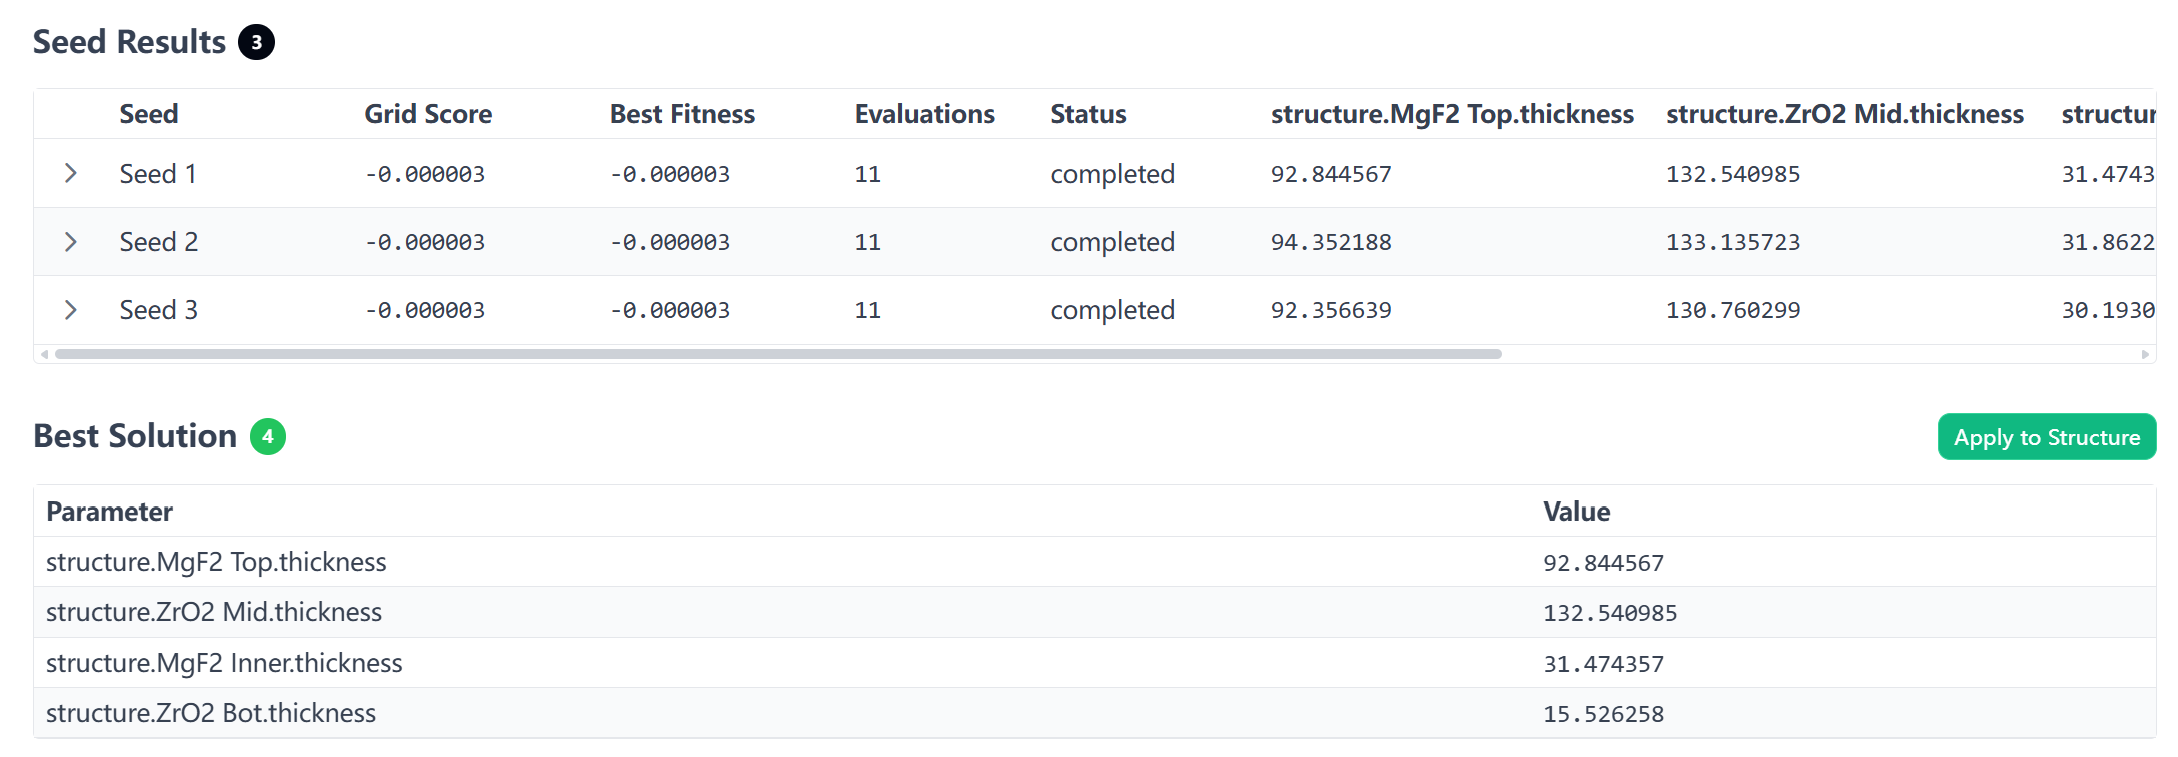
Applying the best solution preserves the materials and layer order while updating the four thicknesses to the report values.
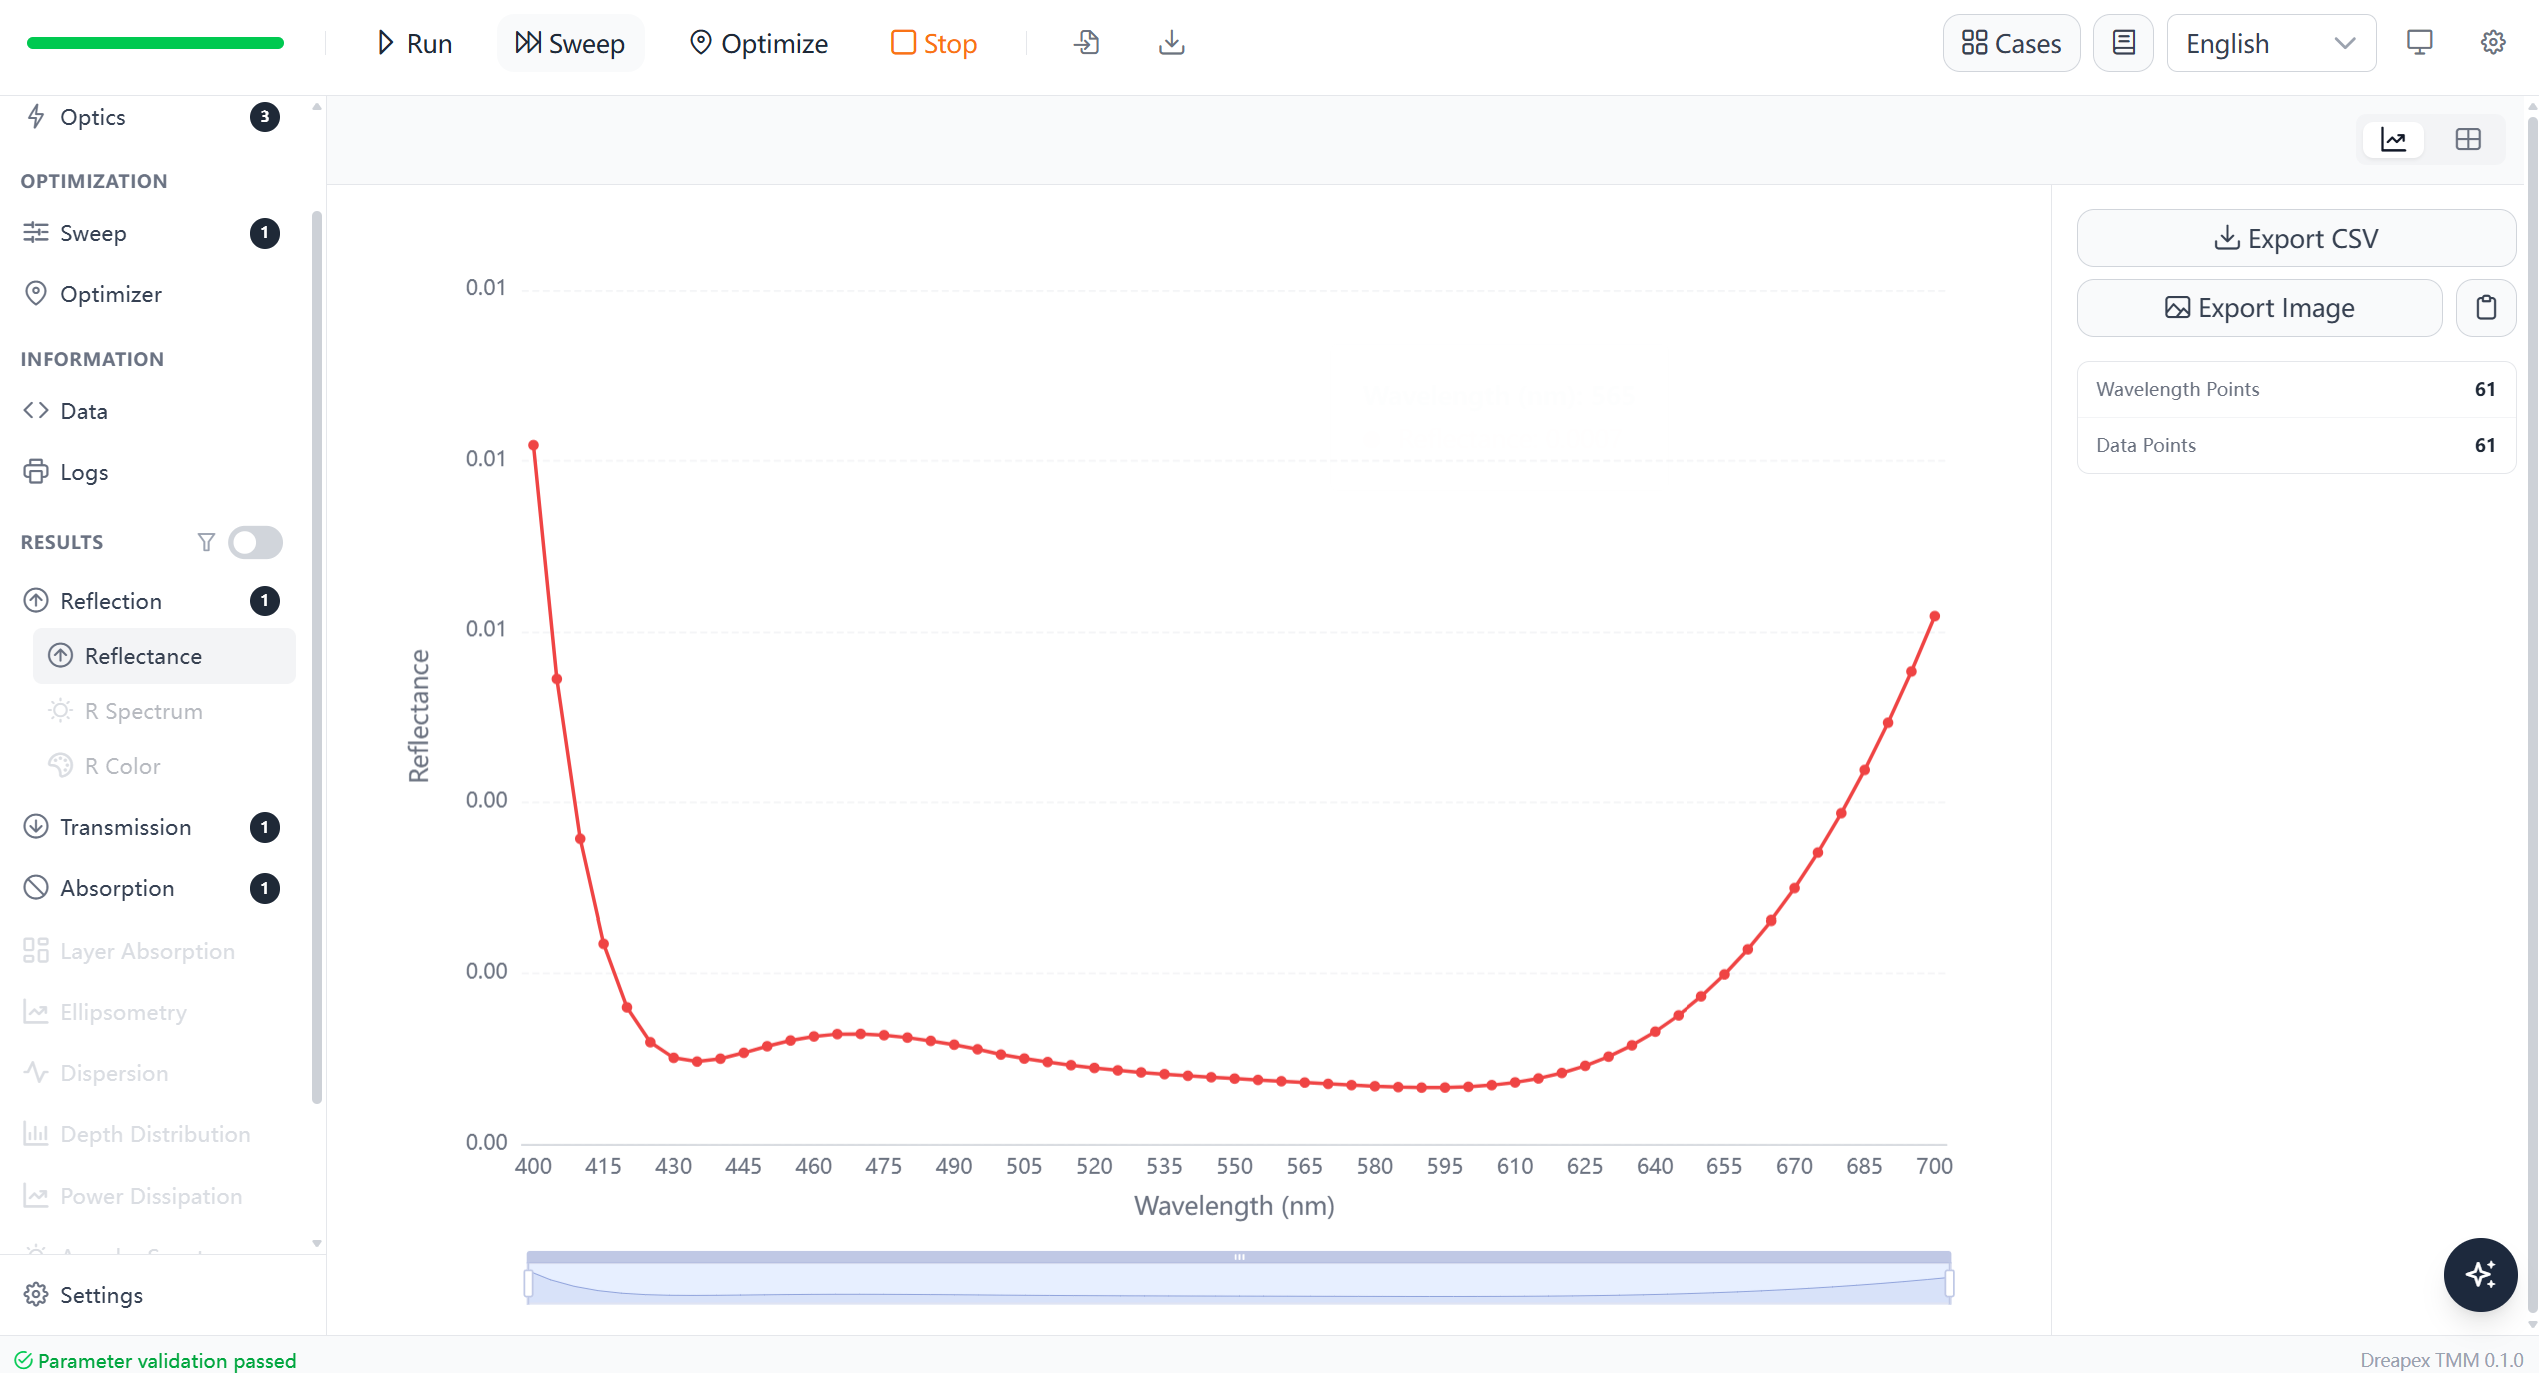
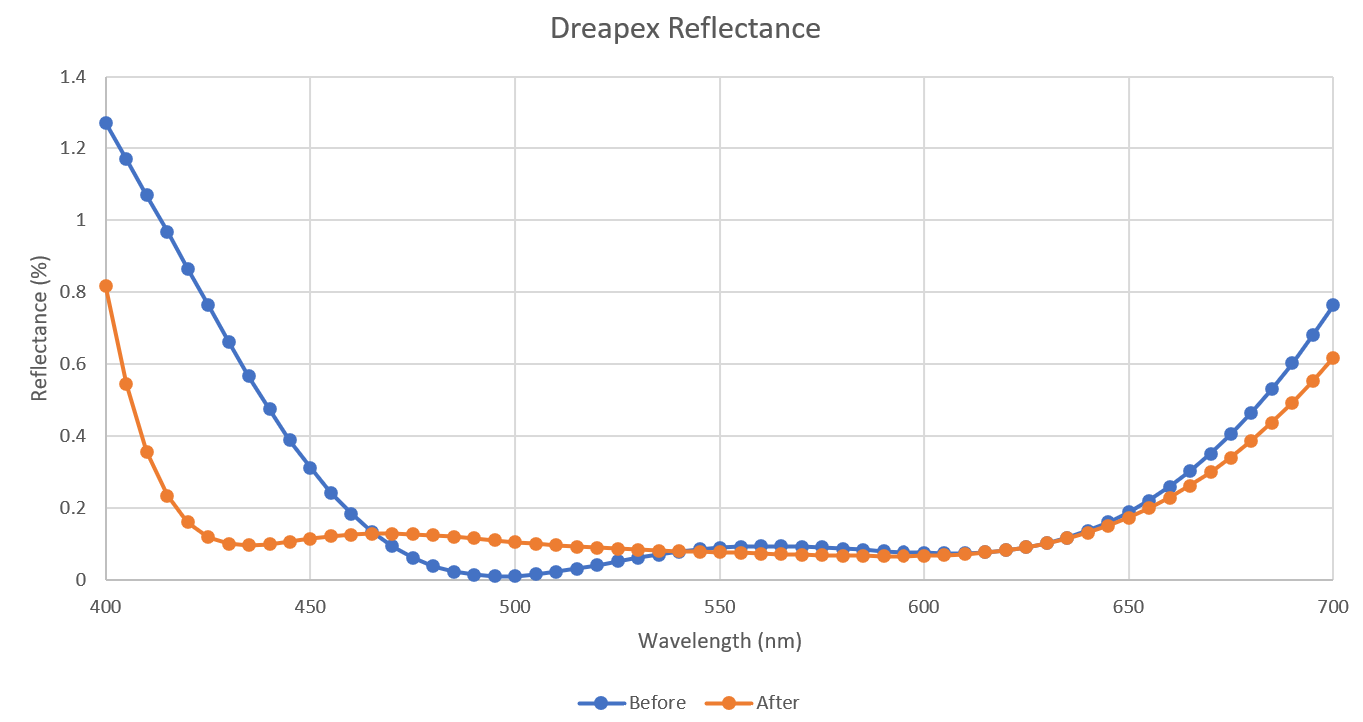
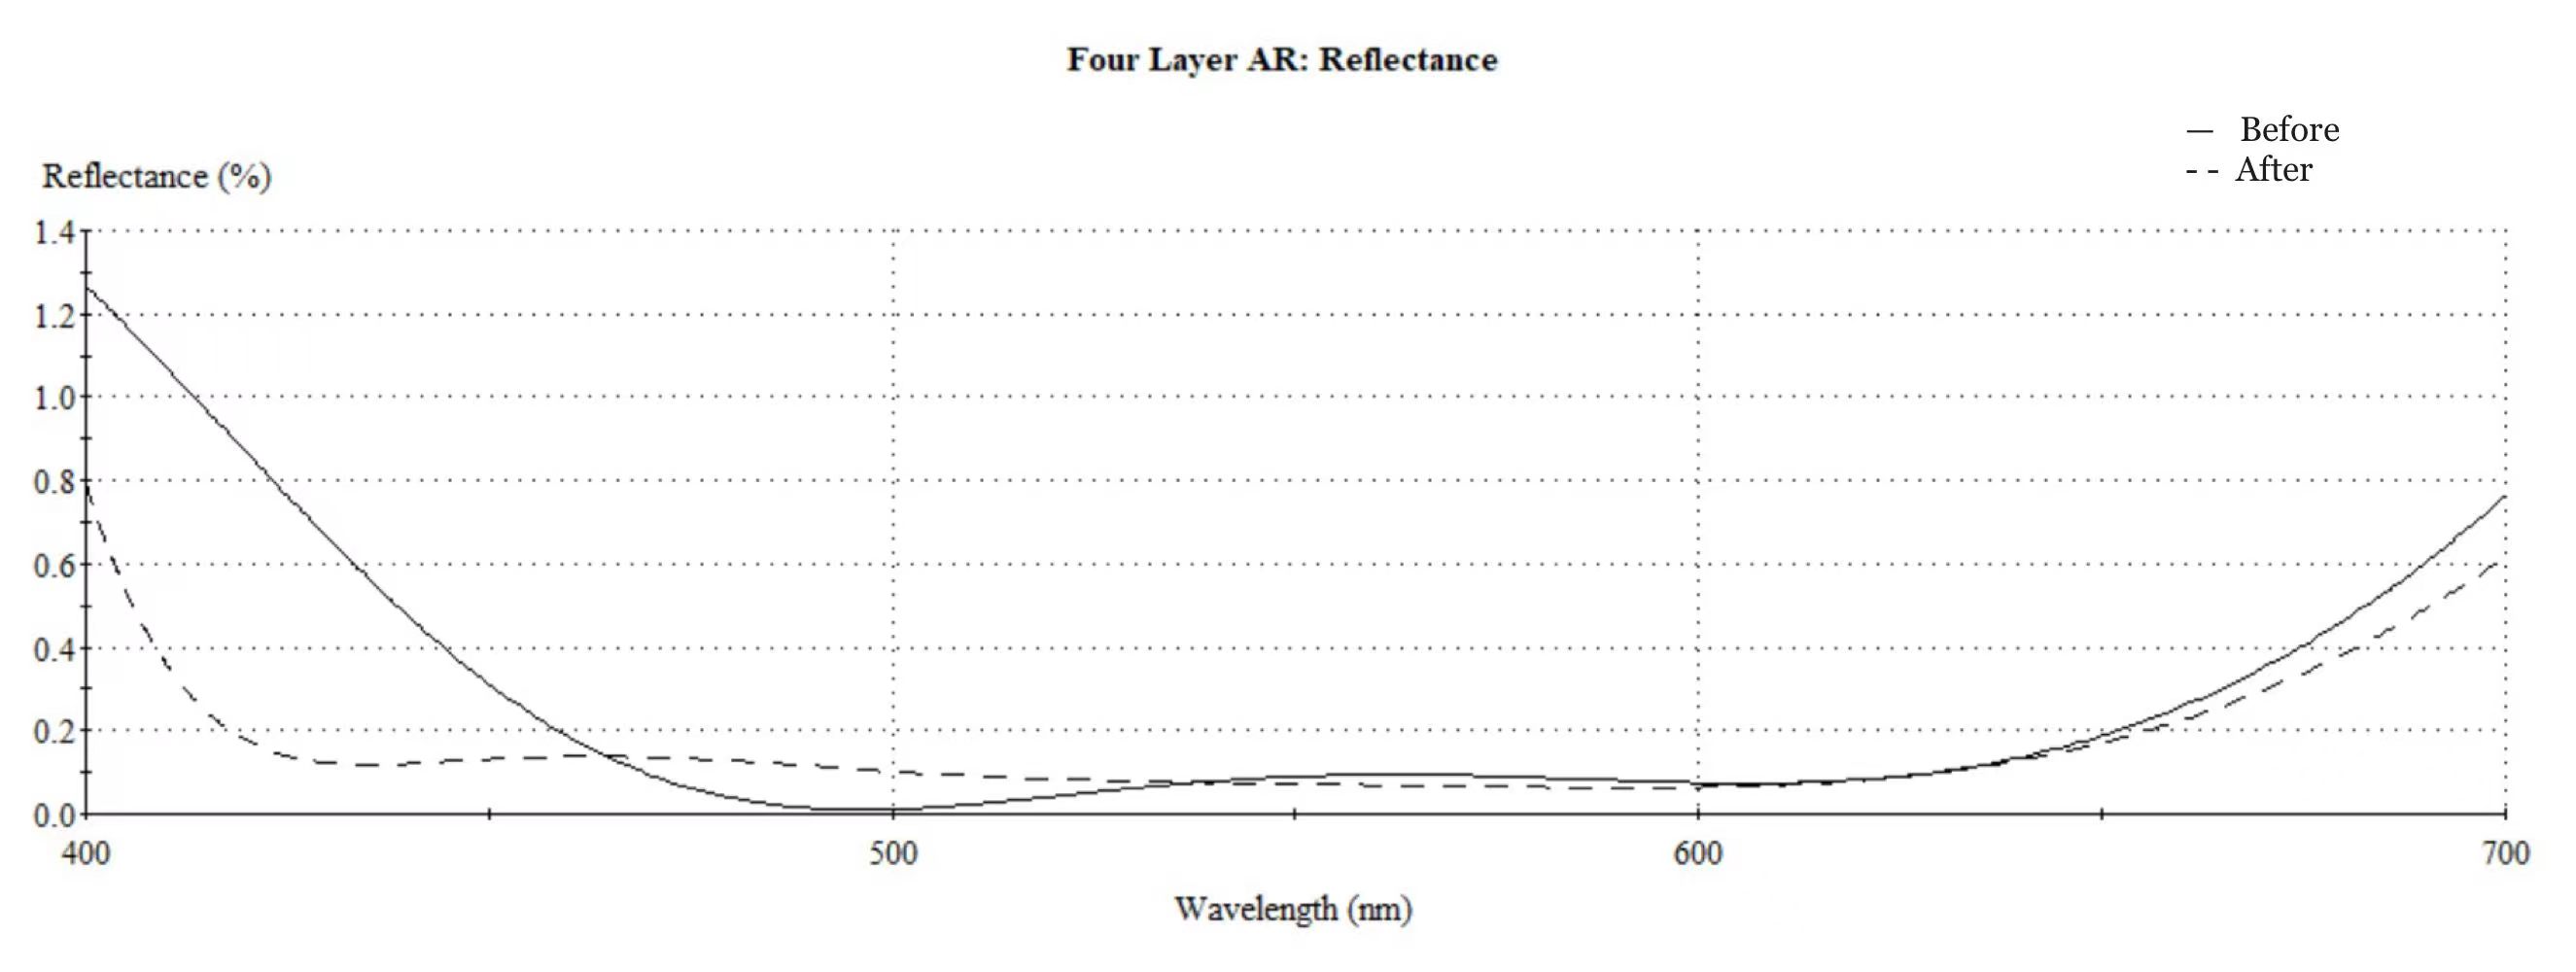
Optimization lowers reflectance across 400–700 nm, with the largest change on the short-wavelength side and a broader low-reflectance region.
Essential Macleod Optimization
Targets and Sampling
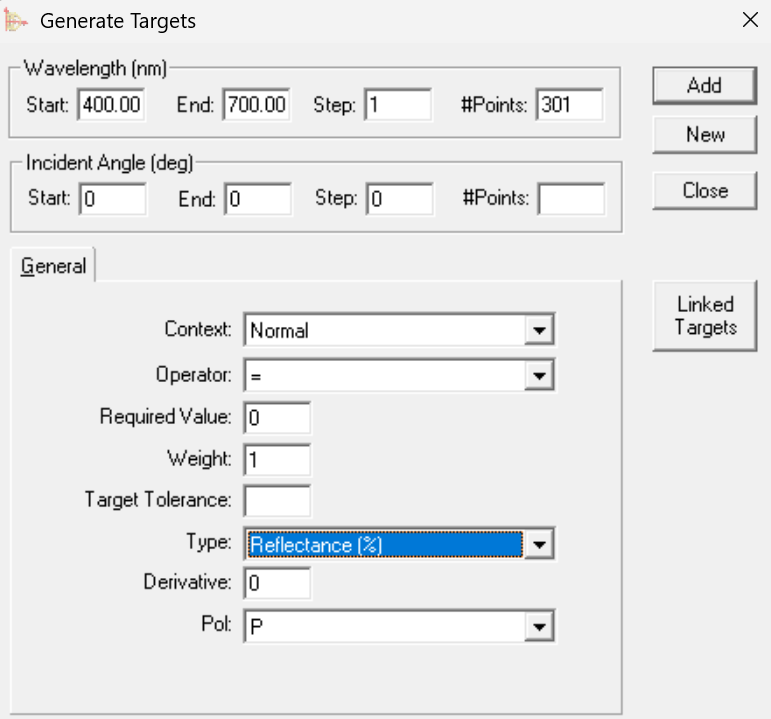
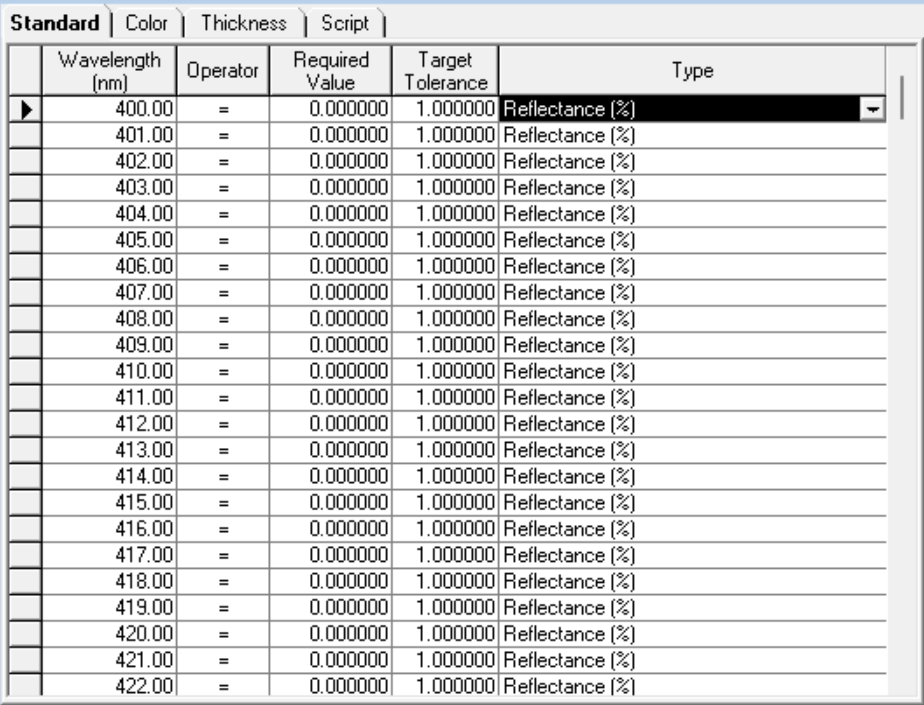
The independent reference generates targets from 400 to 700 nm in 1 nm steps at normal incidence and sets the required Reflectance (%) value to zero.
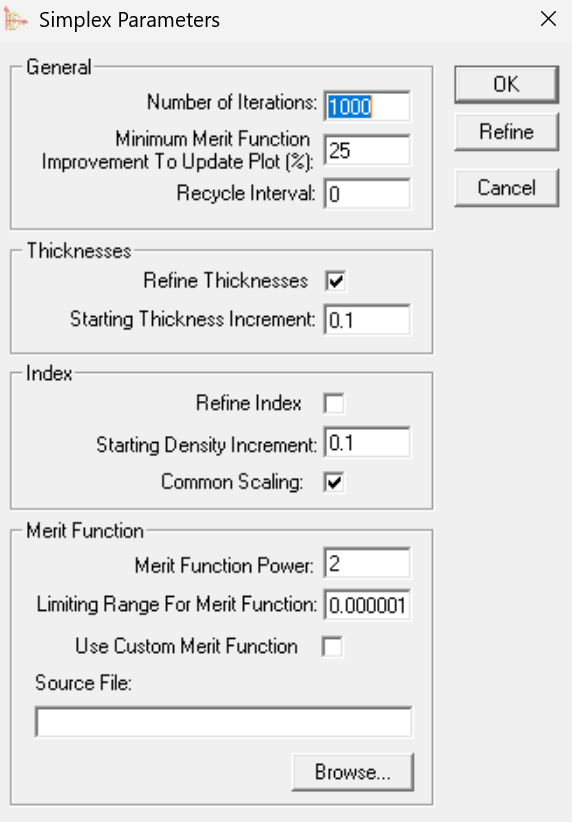
Thickness refinement is enabled with a maximum of 1000 iterations. Because the two programs use different optimization algorithms and stopping conditions, the acceptance test compares relative thickness differences instead of requiring identical last digits.
Results
The reference optimization returns physical thicknesses of 92.96, 132.20, 31.23, and 15.57 nm.
The independent reference also shows lower reflectance across the full band after optimization.
Optimization Cross-Validation
The optimized reflectance curves retain the same broadband low-reflectance profile. The two optimizers settle at slightly different points without changing the principal spectral features.
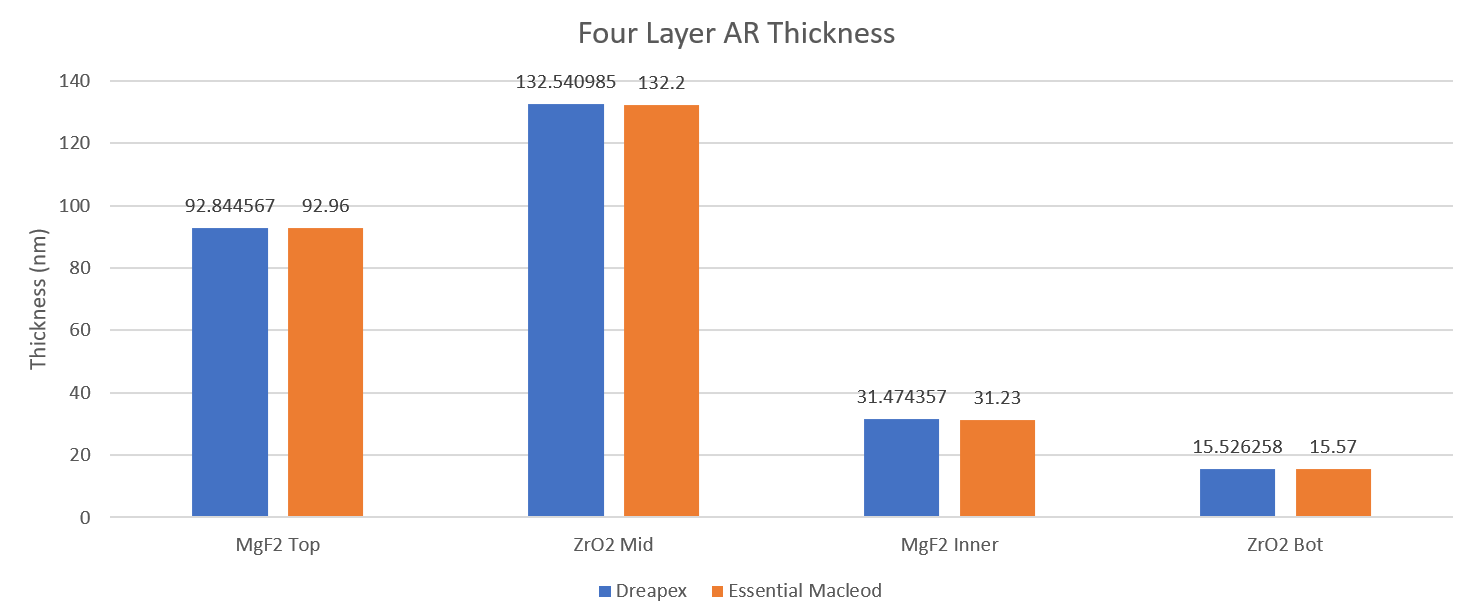
The layer-by-layer comparison places all four variables in the same design neighborhood.
| Layer | Dreapex TMM | Essential Macleod | Absolute difference | Relative difference |
|---|---|---|---|---|
| Top MgF₂ | 92.844567 nm | 92.96 nm | 0.115433 nm | 0.124% |
| Second ZrO₂ | 132.540985 nm | 132.20 nm | 0.340985 nm | 0.258% |
| Third MgF₂ | 31.474357 nm | 31.23 nm | 0.244357 nm | 0.782% |
| Bottom ZrO₂ | 15.526258 nm | 15.57 nm | 0.043742 nm | 0.281% |
The mean relative difference is 0.36%, and the maximum is 0.782%; every layer satisfies the predefined 1% criterion. Agreement of the forward spectra and optimized designs together shows that material-dispersion interpolation, medium-boundary handling, wavelength sampling, and multivariable thickness optimization form a stable and reproducible calculation path for this standard one-dimensional stack.
Scope Limits
The result applies only to the stated one-dimensional planar stack of linear isotropic materials. Surface roughness, scattering, lateral patterning, process gradients, and uncertainty in measured optical constants are outside the model. The original validation record also did not capture the reference-software version. Production work should therefore add thickness-tolerance and material-sensitivity sweeps rather than treating one optimum as a fabrication tolerance.
The recommended audit sequence is to download and confirm the shared material data, verify the starting structure and incidence, compare the forward spectra point by point, align the optimization targets and bounds, and finally calculate the absolute and relative difference for every layer. Continue with RTA and Layer-Absorption Analysis and the Optimizer.