Omnidirectional Reflector
This case is no longer a generic "high-contrast multilayer" illustration. It is rebuilt from the paper's actual PS-Te material system, layer thicknesses, and layer ordering. The objective is not point-by-point fitting. The objective is to test whether the paper's central claim remains visible in a strict 1D model: a nine-layer film maintains a continuous high-reflectance band over 10-15 um at normal incidence, 45°, and 80°, while the TE/TM band edges separate at large angles.
The problem sits entirely within the natural scope of the transfer-matrix method. The structure is stratified only along the thickness direction, the observable is the reflectance spectrum, and the main acceptance criteria are the stop-band interval, angular robustness, and polarization dependence rather than any lateral patterning, diffraction, or localized nanostructure resonance.
Background
An omnidirectional reflector is not defined by a single high-reflectance peak at one angle. The engineering requirement is a wavelength interval that remains highly reflective over a broad angular range and under both polarizations. In practical terms, the design target is a stop band that does not collapse as the incidence cone widens.
The Fink paper is a strong benchmark because it does not stop at the abstract photonic-crystal argument. It gives a fabricable micrometer-scale multilayer with directly usable optical parameters: a polystyrene-tellurium (PS-Te) stack, explicit thickness values, and angle-resolved reflectance spectra. That makes it appropriate for an auditable reproduction in Dreapex TMM.
Paper Details
- Paper: A dielectric omnidirectional reflector
- Authors: Y. Fink, J. N. Winn, S. Fan, C. Chen, J. Michel, J. D. Joannopoulos, E. L. Thomas
- Journal: Science 282(5394), 1679-1682 (1998)
- DOI: 10.1126/science.282.5394.1679
- Comparison target:
Figure 4
The first-pass reproduction focuses on Figure 4 because it contains the decisive evidence: the reflectance spectra at 0°, 45°, and 80° for TE and TM.
The paper provides the critical parameters needed for a direct 1D model:
- Material system:
PS-Te - Layer count:
9 - Layer sequence: alternating layers starting with
Te - Thicknesses:
Te = 0.8 um,PS = 1.65 um - Target reflection band:
10-15 um - Angular range:
0°-80°
Mapping the Paper to the TMM Model
This case uses the paper parameters directly. All materials enter through the application's standard front-end workflow, using either the built-in refractive-index database or files exported from that same database. No result injection is used, and no internal model state is written directly.
| Item | Model used in this case | Reason |
|---|---|---|
| Incidence medium | Air | Consistent with the air-side reflectance measurement in the paper |
| Stack architecture | Te / (PS / Te) x 4 | Nine layers total, equivalent to Te / PS / Te / PS / Te / PS / Te / PS / Te |
| Top Te layer | 0.8 um | Paper thickness |
| PS inside the repeated period | 1.65 um | Paper thickness |
| Te inside the repeated period | 0.8 um | Paper thickness |
| Te source | main/Te/nk/Caldwell-o.yml + main/Te/nk/Sherman-o.yml | The two built-in entries are merged to span 6-15 um, matching the Figure 4 axis |
| PS source | organic/(C8H8)n - polystyrene/nk/Zhang.yml | Extends to 20 um and preserves mid-IR absorption features |
| Transmission medium | Air | The first pass isolates the stop-band behavior of the nine-layer film |
One explicit simplification remains. The experimental sample is deposited on a real substrate, but the first pass uses Air / PS-Te / Air so that the stop-band behavior of the nine-layer film can be checked directly before adding boundary-condition complexity. That approximation affects absolute band-edge positions, but it does not change the primary question of whether a broad angular high-reflectance band exists.
Reproduction Target and Acceptance Criteria
This case uses a semi-quantitative, visual-comparison standard. The reproduction is considered successful if the following four behaviors are present:
- A continuous high-reflectance region appears within
10000-15000 nm. - That region remains present at normal incidence,
45°, and80°. - At large angles, the short-wavelength band edge no longer coincides for
TEandTM, withTMshowing the stronger shift. - The
PSabsorption leaves local dents inside the plateau instead of removing the high-reflectance band entirely.
This first pass does not require point-by-point overlap, full recovery of unpublished substrate details, or a detailed fit of film texture, anisotropy, and roughness.
Modeling Path in Dreapex TMM
The model and the result pages in this section were produced by driving the real front end with Playwright. The workflow follows the application's normal forms, validation rules, and run path. It does not bypass the UI by writing internal state directly.
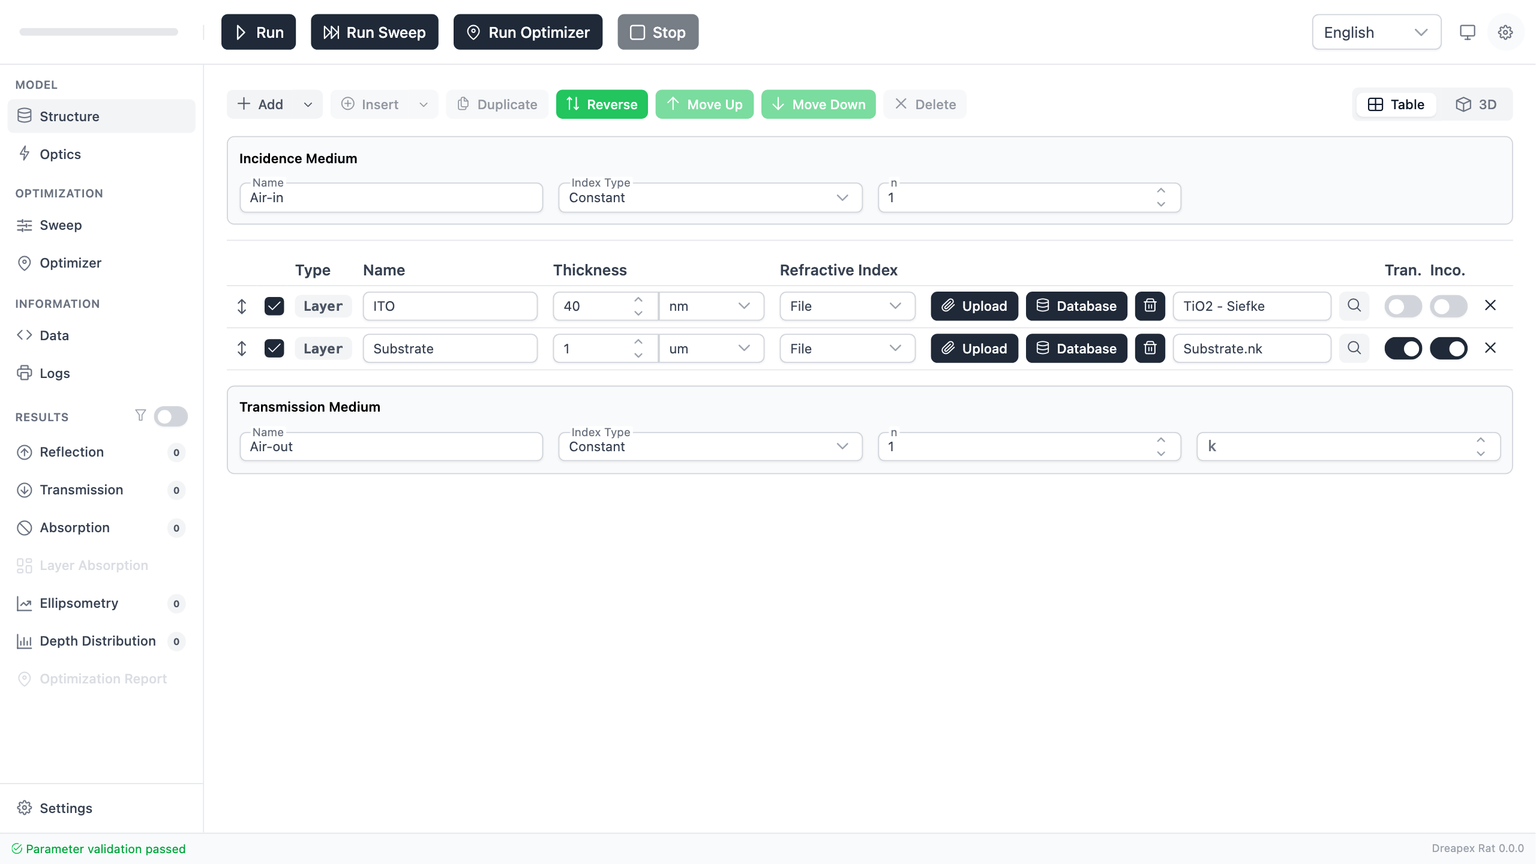
1. Structure Setup
The repeated part of the stack is modeled with a LayerGroup rather than by manually duplicating eight alternating layers one by one. The actual UI sequence is:
- Keep the top single
Telayer and rename itTe Entrance. - Set its thickness to
0.8 um. - Set that layer to
Fileand upload a.nkfile built by combining the built-inCaldwell-oandSherman-oTe entries. - Remove the leftover standalone substrate row so the first-pass free-film approximation remains consistent.
- Add a
LayerGroup, name itPS-Te Period, and set the repeat count to4. - Inside the group, define two rows:
PSandTe. - Set the internal thicknesses to
1.65 umand0.8 um.
That Te file path is used for a specific reason. In the current built-in Te database, no single entry covers the full 6-15 um horizontal span of Figure 4. To keep the result-page axis aligned with the paper, this case extracts the optical constants from two built-in Te entries, merges them into one 6-15 um file, and then loads that file through the standard upload control. The workflow still stays entirely inside the supported front-end validation path.


2. Footer Diagnostics and Pre-Run Check
Before each run, open the diagnostics panel from the bottom Footer and confirm that the current model has no blocking structure or optics errors. This step matters because the front end aggregates unit parsing, material-file validation, and sweep-range checks there. A comparison run is only meaningful after the diagnostic panel confirms the model is ready to solve.
3. Optics and Solver Settings
To match the horizontal axis of the paper's Figure 4, this case uses:
- Wavelength range:
6000-15000 nm - Step:
50 nm - Detector:
Reflectanceonly - Angles:
0°,45°,80° - Polarization:
TEaspRatio = 0TMaspRatio = 1
The result page uses nm on the horizontal axis, so the paper's 10-15 um band appears as 10000-15000 nm in the UI.
Simulation Results and Comparison with Figure 4
Each paper sub-panel is placed directly above its matching Dreapex TMM result page. The paper images are cropped from the local PDF; the TMM images are real result-page captures driven through the live front end.
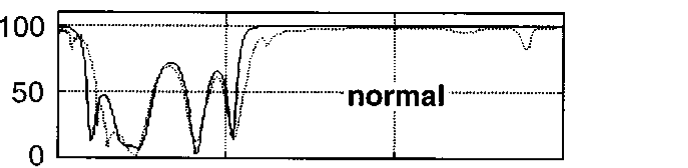
Normal incidence (0°):

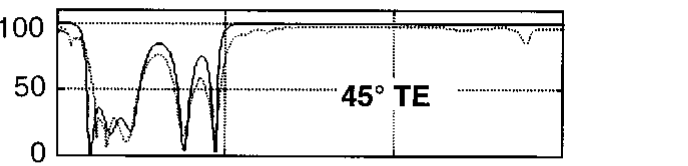
TE, 45°:

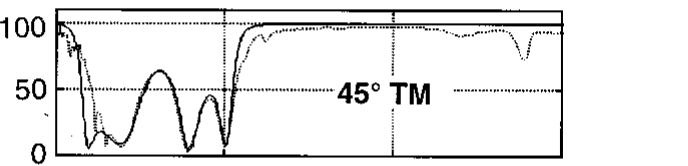
TM, 45°:

TE, 80°:
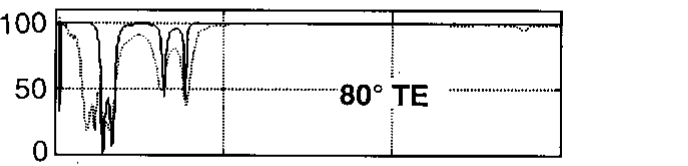

TM, 80°:
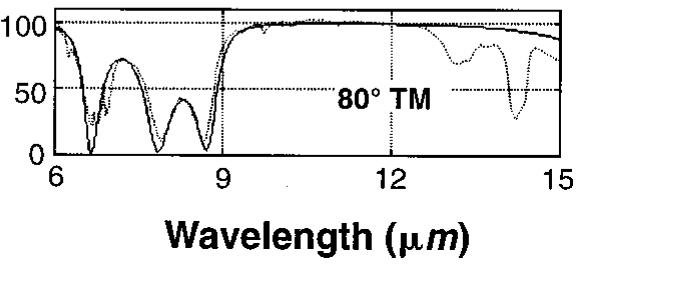

Placed next to Figure 4, the comparison is straightforward:
- At normal incidence, the
10-15 umtarget interval already lies inside a continuous high-reflectance region. - At
45°, bothTEandTMremain broad plateau-like high-reflectance responses rather than collapsing into narrow resonances. - At
80°, theTEbranch still keeps a broad plateau, while the short-wavelength edge ofTMshifts more strongly. That matches the paper's physical interpretation that the more restrictive edge of the omnidirectional band is governed by theTMbranch. - The local dents visible in the platform are consistent with the mid-IR absorption of
PS, which the paper also notes.
The central conclusion is therefore reproduced at the correct level of rigor for a first pass: the structure behaves as a broad angular high-reflectance band, not as a single resonance peak.
Deviation Analysis
Several differences from the original experiment remain and should be stated explicitly:
Teis still treated as a scalar optical-constant input, so any film orientation effects or anisotropy are not modeled here.- The
Tefile is formed by merging theCaldwell-oandSherman-odatabase entries, so a small line-shape kink may appear near the handover region around9 um. - The experimental sample includes a real substrate, while this first pass keeps a free-film approximation. Absolute band-edge locations are therefore more idealized.
- The
PSdata comes from the databaseZhangentry rather than the exact 1998 sample characterization, so the detailed absorption strength and fine structure are not expected to match point by point. - This case reproduces the main angle-dependent reflectance behavior only. It does not yet include process tolerances, interface roughness, or thickness drift.
These factors affect exact line shape, but they do not change the main result already established here: the nine-layer PS-Te stack preserves a high-reflectance band at large angles, and the TM edge is the more angle-sensitive one.
Further Extensions
- Keep
PSfixed and replaceTewith another mid-IR tellurium dataset to quantify the shift of theTMedge. - Add an approximate substrate beneath the nine-layer film and measure how much the transmission-side boundary condition moves the stop band.
- Keep the material datasets fixed and sweep only the
Tethickness to estimate process tolerance around0.8 um. - Sweep
pRatiocontinuously at80°to map the fullTE -> TMtransition instead of checking only the two endpoints.
Overview
Application cases, reproductions, and the entry point for future expansions
Tamm Plasmon at a Metal-DBR Interface
Reconstruct the reflectance resonance reported by Kaliteevski et al. in Dreapex TMM, using a real front-end workflow and stating explicitly which parts of the paper are matched and which parts still remain outside the current model fit.