Ultrathin Absorbing Interference Coatings
Nanometre optical coatings based on strong interference effects in highly absorbing media
Authors: M. A. Kats, R. Blanchard, P. Genevet, and F. Capasso
Journal: Nature Materials 12, 20–24 (2013) · Comparison target: Figure 2c
Put a few to a few tens of nanometres of germanium on a gold mirror and the reflection dip moves steadily with thickness, changing the colour you see — at thicknesses far below the quarter-wave the textbook asks for.
This case deposits Ge on 150 nm of Au, sweeps the Ge thickness, and computes 7° reflection spectra and reflected colour for comparison with paper Figure 2c.
The dip of each of the five traces moves monotonically to the red as Ge thickens, and none of them falls below the gold baseline.
Background
Conventional thin-film design assumes interference requires transparent or weakly absorbing layers. Kats et al. formalize a different regime: a few to a few tens of nanometres of a highly absorbing film on a metal produces non-trivial reflection-phase shifts at both interfaces, so an absorption resonance forms at thicknesses well below λ/(4n₂).
The full published Figure 2 gives the context — panel a shows the n,k inputs, panel b the measured reflection at 7°, panel c the calculated reflection that this case targets, and panel d the absorbed fraction in the Ge layer. View all four panels in the original paper.
Structure
| Item | Model value | Notes |
|---|---|---|
| Incidence medium | Air | Matches the paper's air-side measurement geometry |
| Top layer | Ge, thickness swept over 5, 10, 15, 20, 25 nm | A uniform 5 nm step is the closest uniform sweep to the paper's 7/10/15/20/25 sequence |
| Bottom layer | Au, 150 nm | The paper deposits Ge on 150 nm of e-beam Au, optically thick across the visible |
| Transmission medium | Air | The 150 nm Au is opaque across the visible, so the through-substrate contribution is negligible |
| Ge optical data | Built-in Aspnes database entry | The paper instead uses ellipsometry on its own deposited films |
| Au optical data | Built-in Johnson database entry | — |
Only two layers are needed: a top Ge layer at 15 nm (the sweep supplies the rest) with the Ge entry from the database, and an Au layer at 150 nm, with a semi-infinite backing to suppress transmission.
Choosing the Ge optical constants from the built-in database:
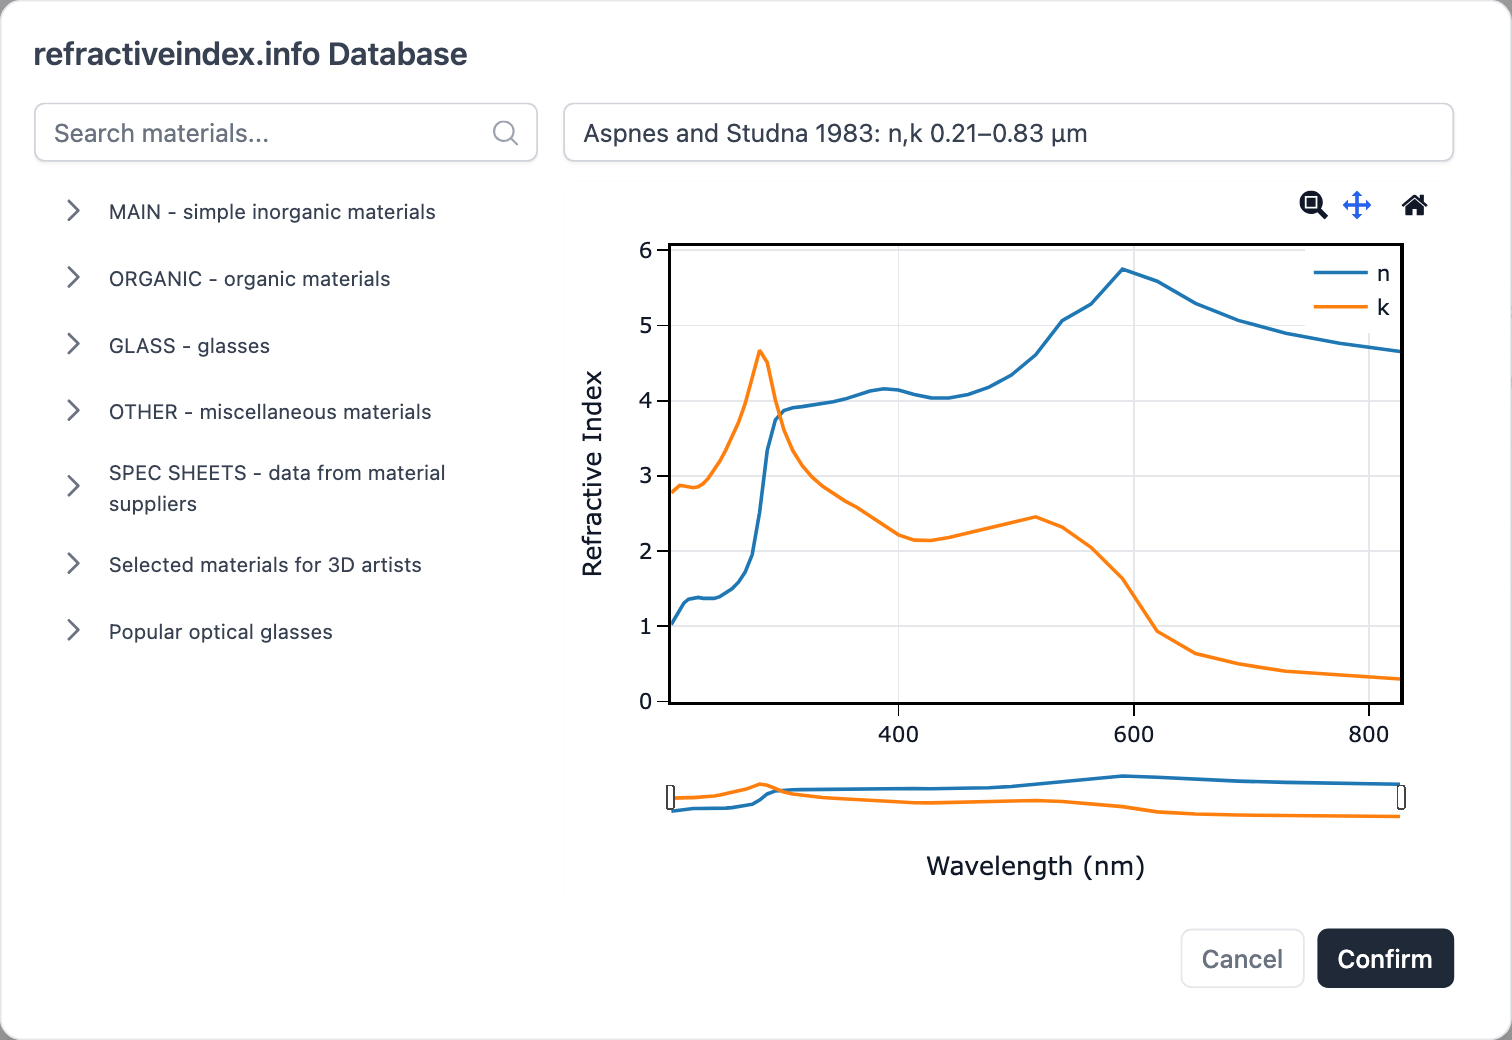
The resulting two-layer structure page:

Optical Settings
| Setting | Value |
|---|---|
| Wavelength range | 400–824 nm, step 2 nm |
| Incidence angle | 7° |
| Polarization | pRatio = 0.5 (unpolarized), matching the paper's measurement convention |
| Detector | Reflectance |
| Sweep variable | Top-layer thickness, from = 5, to = 25, step = 5 |
The 824 nm upper limit comes from the built-in Ge dataset, which reaches only 826.6 nm.

Optimize. If a notice related only to Optimize appears at the bottom of the page, continue with Sweep.Simulation Results and Comparison with Figure 2c
Paper Figure 2c is in the original article.
The same sweep in the app, five traces ordered by Ge thickness:

Three features match the paper: the dip walks monotonically toward the red as Ge thickens; no trace collapses below the Au baseline, since the metal mirror keeps every curve reflection-dominated; and the two thinnest films show a defined dip inside 500–600 nm before climbing back at long wavelengths.
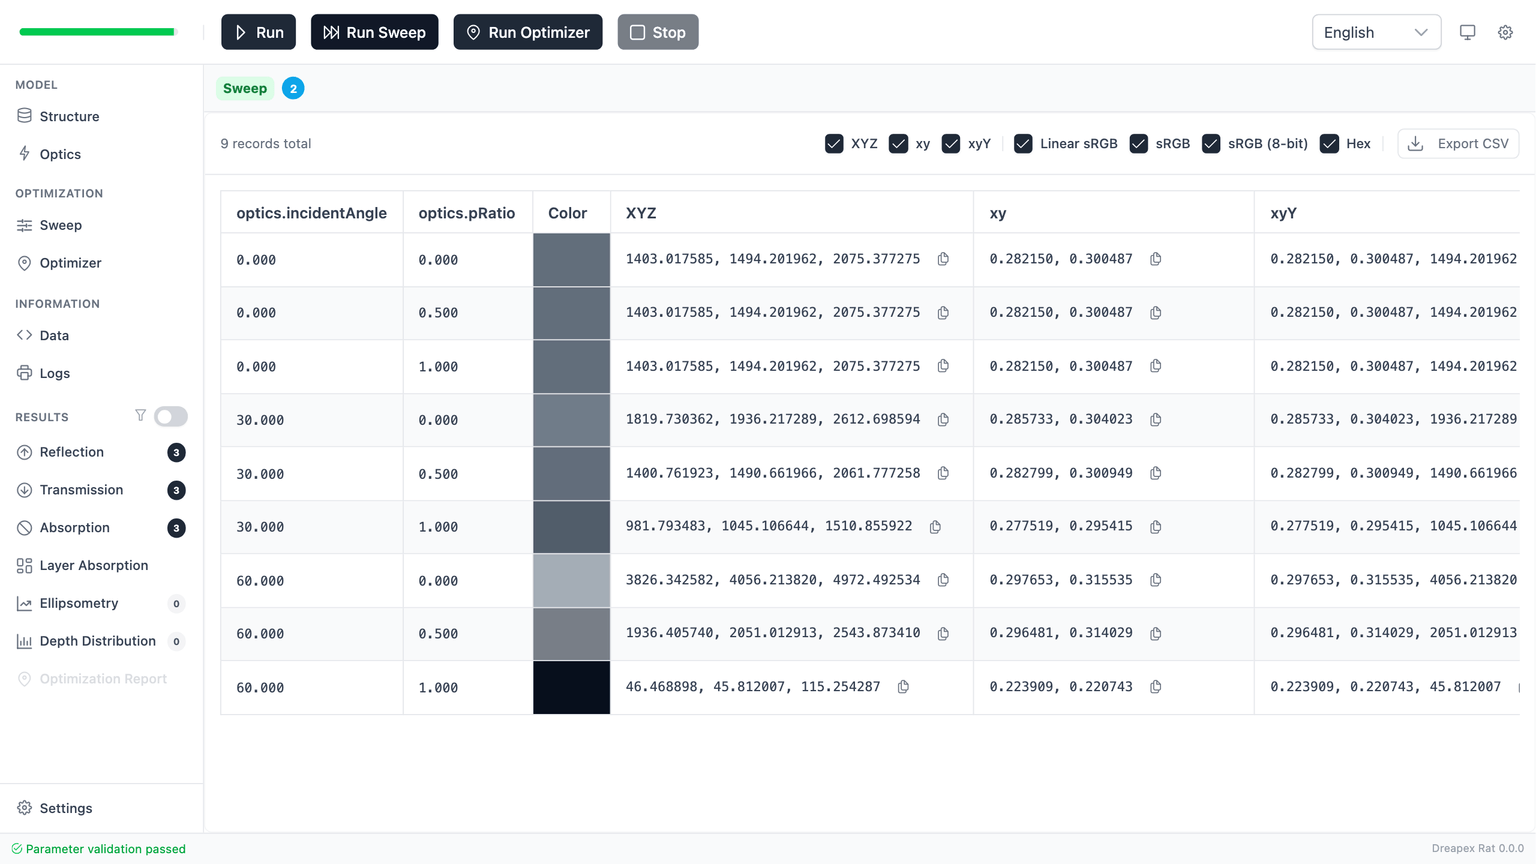
Switching the same stack to Reflection Color turns that thickness-driven spectral shift into a continuous colour sequence:
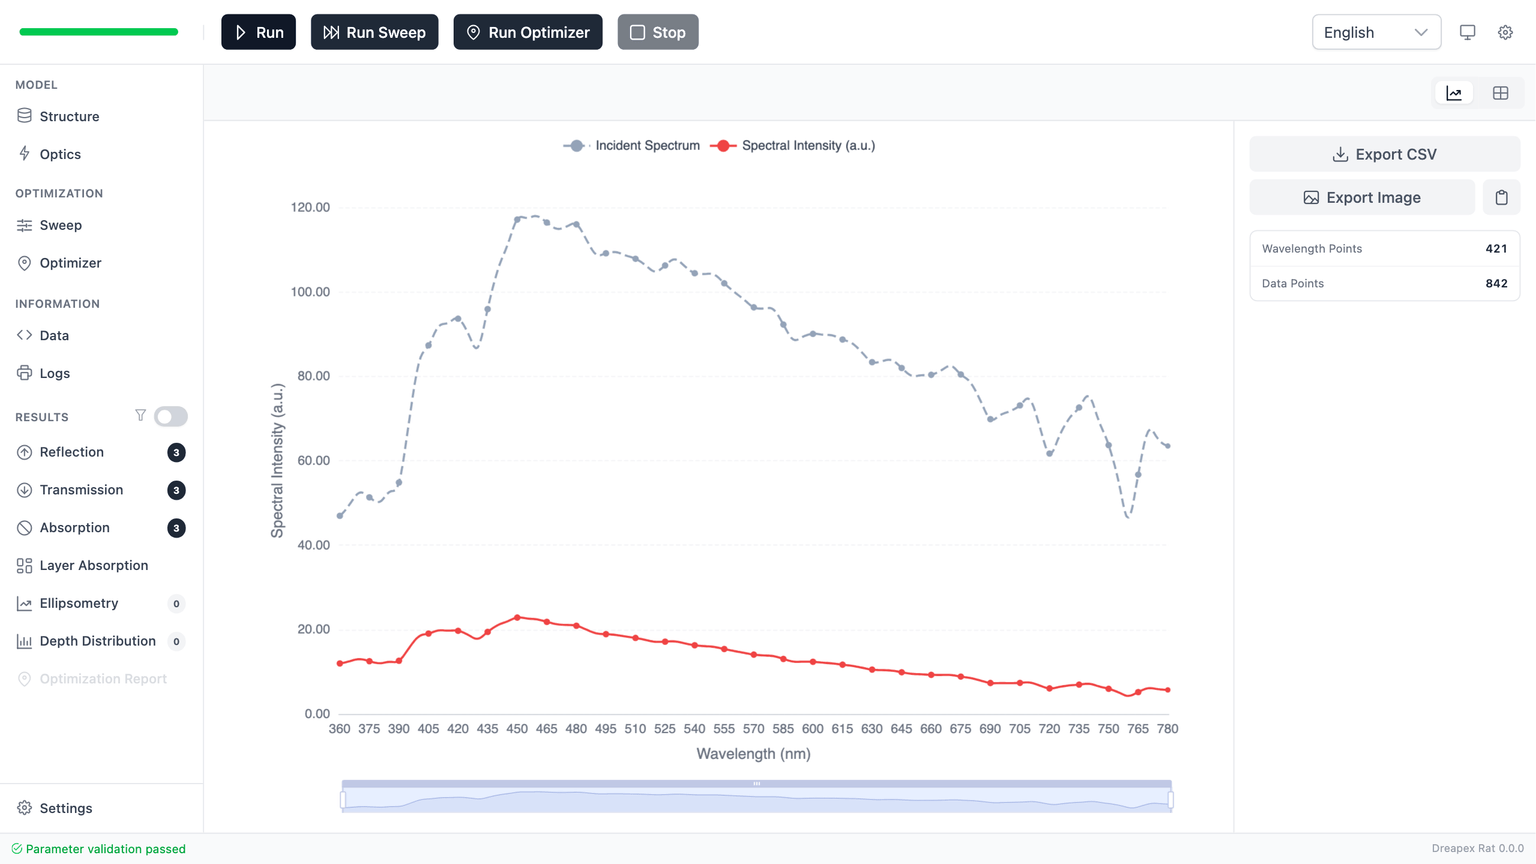
The Reflection Spectrum page reads the local spectral detail of a single thickness:
Deviation Notes
The thinnest trace uses 5 nm in place of the paper's 7 nm: the sweep supports only uniform steps, and 5 nm is the closest uniform value to the published sequence, so its dip sits slightly bluer.
Both materials use published database data, while the paper uses ellipsometry on its own films, so absolute dip depth and crossover wavelength shift as a whole; a different Au dataset would also redistribute the interface phase and relocate the dips slightly.
The model contains no surface roughness, no native oxide on the Ge, and no Au–Ge interfacial reaction.