White Spectra and Color Assessment
Emission Simulation Benchmark Report
2.10 Finite-band white emission and color assessment
The flat white-spectrum control uses n = 1 and k = 0 in all enabled media, 360–830 nm, isotropic dipoles, emission position 0.5 and current density 100 A/m², intrinsic quantum efficiency 1, conversion efficiency 0.25, spectrum multiplier 1 and Physical area. In Dreapex TMM select a File emission spectrum in power units, with equal values of 1 at 360 nm and 830 nm. For this explicitly finite-band configuration, 127,170 total, s and p spectral values differ by less than 0.174 ppm.
| Channel | Paired values | Max. relative difference / ppm |
|---|---|---|
| total | 42,390 | 0.0602017 |
| s | 42,390 | 0.173577 |
| p | 42,390 | 0.173577 |
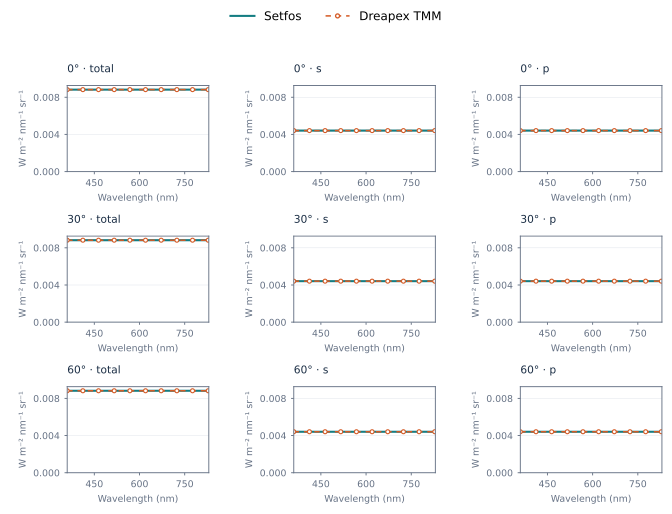
Figure 47. Finite-band white spectra at 0°, 30° and 60°
Material optical constants and the emission spectrum must cover the entire wavelength scan; this section uses the finite-band File configuration above.
2.10.1 CCT and CRI
Both color assessments use the same output spectrum. Select linear interpolation (5 nm) and McCamy (1992) for CCT. Across four white-spectrum cases, available directions differ by at most 1.815 K. Dreapex TMM withholds CCT outside the white-locus or method-validity range. Results using Ohno are listed below.
| Configuration | CCT available | Max. difference / K | CRI available | Max. Ra absolute difference |
|---|---|---|---|---|
| Bottom-emission white | 47/90 | 1.07202 | 90/90 | 7.40488 |
| Top-emission white | 28/90 | 1.10742 | 48/90 | 1.32016 |
| Emitter only | 90/90 | 1.60216 | 90/90 | 0.131532 |
| Uniform medium | 90/90 | 1.8143 | 90/90 | 1.35432 |
With Ohno, white-spectrum differences reach about 468.500 K and two-emitter differences about 1097.785 K. Standard 1 nm photometry with McCamy differs by up to 2.334 K for the four white spectra; narrowband spectra do not support that full-band setting.
| Configuration | 5 nm / Ohno available | Max. difference / K | 1 nm / Ohno available | Max. difference / K |
|---|---|---|---|---|
| Bottom white | 56/90 | 173.086 | 56/90 | 171.463 |
| Top white | 61/90 | 467.144 | 61/90 | 468.5 |
| Emitter only | 90/90 | 13.5401 | 90/90 | 13.5438 |
| Uniform medium | 90/90 | 1.65168 | 90/90 | 1.66415 |
| Two emitters / physical area | 77/90 | 1097.78 | 0/90 | — |
| Two emitters / projected area | 77/90 | 1097.78 | 0/90 | — |
CRI uses the Dreapex TMM CIE 13.3-1995 assessment and requires a complete 360–830 nm spectrum. Maximum Ra differences in the four white-spectrum cases are 7.405, 1.321, 0.132 and 1.355. The uniform-medium case uses different daylight and Planckian reference definitions; the other differences remain under investigation. CRI is unavailable for the 11 narrowband or two-emitter datasets without the complete input range. Two-emitter CCT differences are below 0.966 K within the McCamy-valid directions.
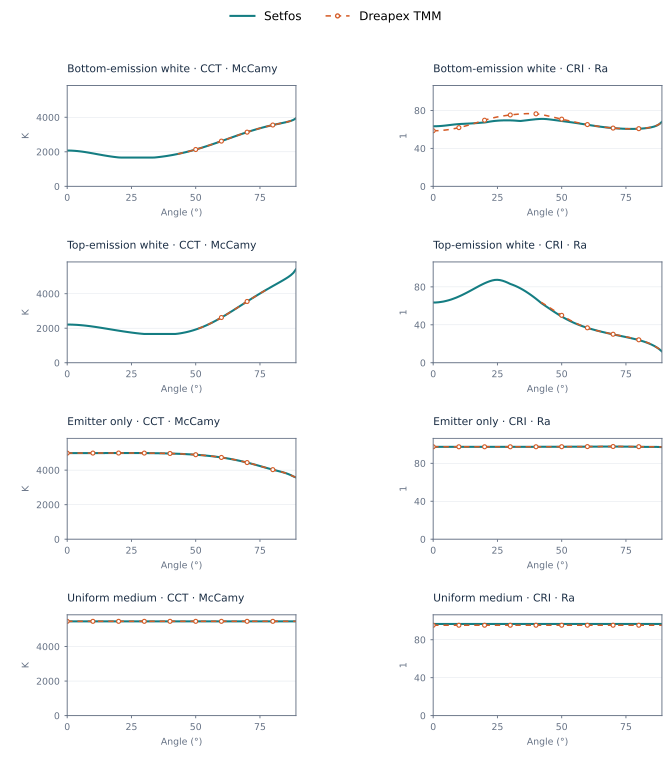
Figure 48. CCT and CRI method comparisons for four white spectra