Emission Validation
Power Dissipation Coordinates and Top Emission
Dreapex TMM and Setfos emission benchmark: Power Dissipation Coordinates and Top Emission.
Emission Simulation Benchmark Report
2.9 Power Dissipation coordinates and the top-emitting stack
The Power Dissipation axis in Dreapex TMM is set to normalized in-plane wave vector u, effective index n_eff, or in-plane wave vector k∥, matching each reference coordinate and range. All three coordinates are covered for bottom emission, and u for top emission. Dissipated, top-radiated and bottom-radiated power are compared in total, s and p for each dataset.
| Configuration / component | total / ppm | s / ppm | p / ppm |
|---|---|---|---|
| Bottom / u / Dissipated | 0.605140 | 0.597132 | 0.610644 |
| Bottom / u / Top | 0.610716 | 0.598894 | 0.602840 |
| Bottom / u / Bottom | 0.604945 | 0.586797 | 0.592930 |
| Top / u / Dissipated | 0.594144 | 0.593635 | 0.597773 |
| Top / u / Top | 0.568628 | 0.594943 | 0.587270 |
| Top / u / Bottom | 0.588833 | 0.595175 | 0.609221 |
| Bottom / n_eff / Dissipated | 0.114682 | 0.114682 | 0.114682 |
| Bottom / n_eff / Top | 0.114682 | 0.114682 | 0.114682 |
| Bottom / n_eff / Bottom | 0.114682 | 0.114682 | 0.114682 |
| Bottom / k∥ / Dissipated | 0.114682 | 0.114682 | 0.114682 |
| Bottom / k∥ / Top | 0.114682 | 0.114682 | 0.114682 |
| Bottom / k∥ / Bottom | 0.114682 | 0.114682 | 0.114682 |
Representative numerical values. λ = 620 nm; u = 0.80 for top emission, k∥ = 0.008 nm⁻¹ for bottom emission.
| Condition | Metric | Setfos | Dreapex TMM | Absolute difference |
|---|---|---|---|---|
| TE · total | Dissipated / W·m⁻²·nm⁻¹ | 0.9502023 | 0.950202436 | 1.36e-07 |
| TE · s | Dissipated / W·m⁻²·nm⁻¹ | 0.005111674 | 0.00511167461 | 6.06e-10 |
| TE · p | Dissipated / W·m⁻²·nm⁻¹ | 0.9450907 | 0.945090761 | 6.09e-08 |
| TE · total | Top radiation / W·m⁻²·nm⁻¹ | 0 | 0 | 0 |
| TE · s | Top radiation / W·m⁻²·nm⁻¹ | 0 | 0 | 0 |
| TE · p | Top radiation / W·m⁻²·nm⁻¹ | 0 | 0 | 0 |
| BE · total | Dissipated / W·m⁻²·nm⁻¹ | 2.27430728 | 2.27430754 | 2.61e-07 |
| BE · total | Top radiation / W·m⁻²·nm⁻¹ | 2.13810824 | 2.13810849 | 2.45e-07 |
| BE · total | Bottom radiation / W·m⁻²·nm⁻¹ | 0.00038221789 | 0.000382217934 | 4.38e-11 |
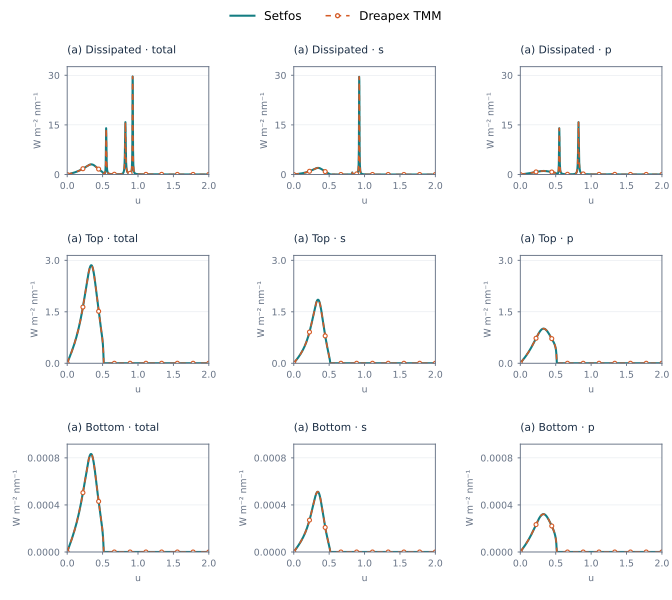
Figure 45. Top emission · u: Power Dissipation at 620 nm
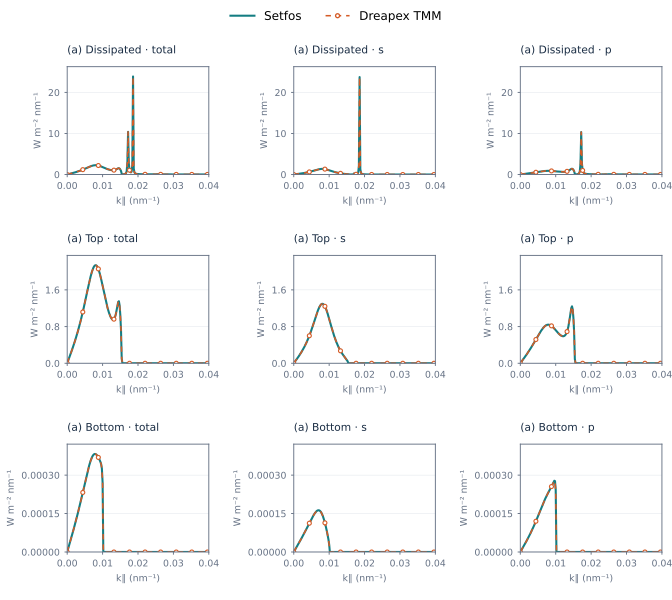
Figure 46. Bottom emission · k∥: Power Dissipation at 620 nm