Emission-Position Distributions
Emission Simulation Benchmark Report
2.8 Emission-position distributions
Gaussian and exponential emission-position distributions are evaluated in a 20 nm emissive layer. Position (0–1) is set to 0.1, placing the peak 2 nm from the upper interface; Width is swept from 2 to 50 nm in 2 nm steps. In Dreapex TMM, select Gaussian or Exponential under Distribution and set Samples to 20, giving a 1 nm spatial interval. The four Spectrum datasets are reported with their measured differences and the effect of spatial sampling.
| Configuration | total / % | s / % | p / % |
|---|---|---|---|
| Bottom / Exponential | 2.788976 | 2.788958 | 2.788958 |
| Bottom / Gaussian | 2.593419 | 2.593401 | 2.593401 |
| Top / Exponential | 2.032138 | 2.032138 | 2.032138 |
| Top / Gaussian | 1.891643 | 1.891643 | 1.891643 |
Representative numerical values. λ = 626 nm, θ = 0°, distribution width 2 nm.
| Condition | Metric | Setfos | Dreapex TMM | Absolute difference |
|---|---|---|---|---|
| BE · Exp · total | Spectral intensity / W·m⁻²·nm⁻¹·sr⁻¹ | 0.2306726 | 0.232206391 | 1.53e-03 |
| BE · Exp · s | Spectral intensity / W·m⁻²·nm⁻¹·sr⁻¹ | 0.1153363 | 0.116103195 | 7.67e-04 |
| BE · Exp · p | Spectral intensity / W·m⁻²·nm⁻¹·sr⁻¹ | 0.1153363 | 0.116103195 | 7.67e-04 |
| BE · Gauss · total | Spectral intensity / W·m⁻²·nm⁻¹·sr⁻¹ | 0.229904 | 0.231343941 | 1.44e-03 |
| BE · Gauss · s | Spectral intensity / W·m⁻²·nm⁻¹·sr⁻¹ | 0.114952 | 0.115671971 | 7.20e-04 |
| BE · Gauss · p | Spectral intensity / W·m⁻²·nm⁻¹·sr⁻¹ | 0.114952 | 0.115671971 | 7.20e-04 |
| TE · Exp · total | Spectral intensity / W·m⁻²·nm⁻¹·sr⁻¹ | 0.321258 | 0.32263869 | 1.38e-03 |
| TE · Gauss · total | Spectral intensity / W·m⁻²·nm⁻¹·sr⁻¹ | 0.320642 | 0.321957004 | 1.32e-03 |
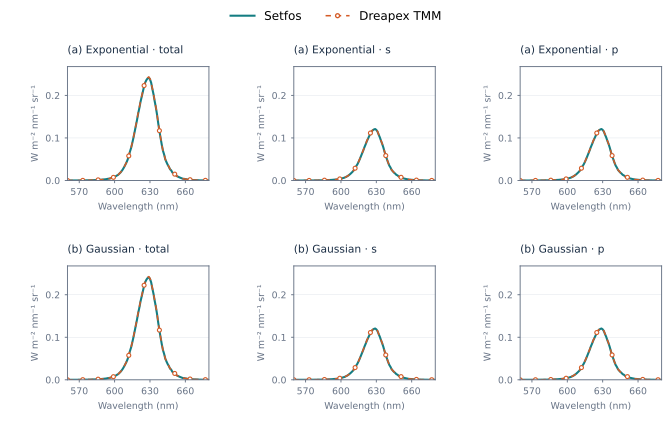
Figure 42. Bottom emission: distribution width 2 nm, Spectrum
The table reports maximum relative differences for the current Dreapex TMM outputs across all 25 widths and all wavelengths in each dataset. The independent check below shows that the pairing of emission weights and optical-response positions on the finite spatial grid explains the differences in this dataset. This spatial-sampling comparison is evaluated separately from the headline relative-difference share; all measured product outputs are retained.
2.8.1 Spatial sampling and result comparison
Width definitions, peak positions and total emission weights have been checked. The difference is how the emission assigned to each 1 nm cell is paired with an optical-response position. For the 2–3 nm cell, Dreapex TMM evaluates both density and optical response at the midpoint. A rule numerically equivalent to this Setfos dataset uses endpoint densities to assign cell emission and evaluates the optical response at the left endpoint.
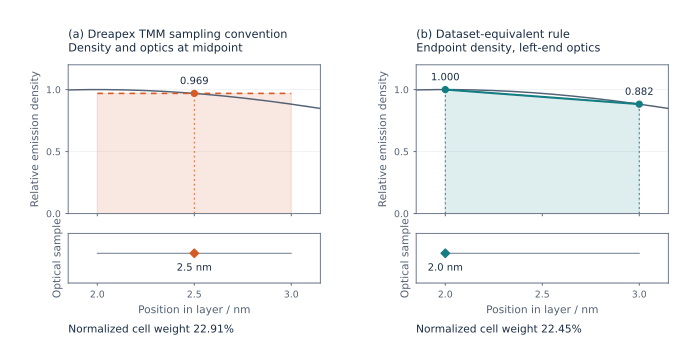
Figure 43. Density and optical-response sampling within a 1 nm cell
Both rules preserve a total weight of 100%. The half-cell difference is spatial; it does not imply a shift toward shorter wavelengths. The equivalent rule was independently checked across four datasets, 100 width configurations and 36,300 Spectrum values, with a maximum relative difference of 0.603708 ppm. This supports the numerical explanation for this dataset, without establishing an internal implementation for all reference configurations.
| Equivalent-rule check | total / ppm | s / ppm | p / ppm |
|---|---|---|---|
| Bottom / Exponential | 0.603708 | 0.584825 | 0.584825 |
| Bottom / Gaussian | 0.590827 | 0.562117 | 0.562117 |
| Top / Exponential | 0.571871 | 0.593132 | 0.593132 |
| Top / Gaussian | 0.595972 | 0.584296 | 0.584296 |
2.8.2 Continuous distributions and numerical accuracy
Closer agreement with a fixed-grid reference does not by itself establish more accurate continuous integration. Spatial sampling is tested separately using a truncated Gaussian with an analytic solution: layer thickness 20 nm, peak position 2 nm and width 2 nm. The test quantity is the emission-weighted mean position, whose continuous value is 2.575200 nm. Boundary truncation makes the mean differ from the peak position.
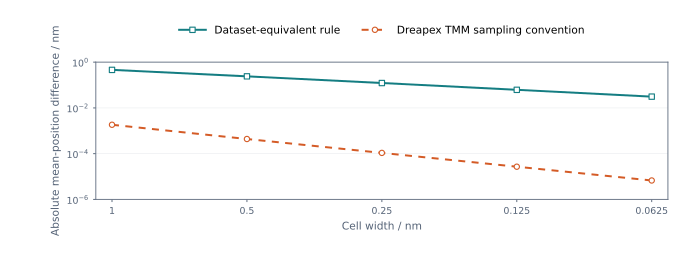
Figure 44. Independent mean-position check: cell width and deviation
| 1 nm grid | Mean position / nm | Absolute difference from the continuous value / nm |
|---|---|---|
| Continuous analytic value | 2.575200 | 0 |
| Dreapex TMM | 2.573364 | 0.001836 |
| Dataset-equivalent rule | 2.114971 | 0.460229 |
Dreapex TMM is more accurate in this independent mean-position check: midpoint sampling is closer to the continuous value and converges faster under refinement. Assigning cell emission to the left-end optical response can reduce accuracy. This test does not rank the accuracy of actual device spectra. Dreapex TMM retains midpoint sampling, and the report retains the measured differences of approximately 1.9%–2.8%. The diagnostic equivalent rule is not counted as a product output in the cumulative share. Actual spectral accuracy requires further grid-convergence verification.