Emission Direction, Area and Orientation
Emission Simulation Benchmark Report
2.3 Top emission, bottom emission and blue emitters
This section uses the supplied top- and bottom-emitting stacks with their respective red or blue materials and emission spectra. These are separate device configurations. The emission-angle scan is 0°–89° in 1° steps; the red and blue wavelength ranges are 560–680 nm and 400–650 nm. Dreapex TMM uses Physical area normalization. Spectra, angular distributions, chromaticity and efficiency are compared under matching settings.
| Configuration | total / ppm | s / ppm | p / ppm |
|---|---|---|---|
| (a) Red bottom emission | 0.605019 | 0.608015 | 0.602542 |
| (b) Red top emission | 0.600041 | 0.607251 | 0.611378 |
| (c) Blue bottom emission | 0.598692 | 0.588995 | 0.603129 |
| (d) Blue top emission | 0.600427 | 0.604392 | 0.610789 |
| Configuration | CIE xy abs. diff. | Blue Index / ppm | Photometry / ppm | CE / ppm | Efficacy / ppm |
|---|---|---|---|---|---|
| (a) Red bottom emission | 4.967e-08 | 0.537226 | 0.514641 | 0.514641 | 0.231968 |
| (b) Red top emission | 4.995e-08 | 0.434899 | 0.402689 | 0.402689 | 0.244164 |
| (c) Blue bottom emission | 4.965e-08 | 0.587721 | 0.453736 | 0.453736 | 0.433832 |
| (d) Blue top emission | 4.947e-08 | 0.487904 | 0.499271 | 0.499271 | 0.373109 |
Representative numerical values. θ = 30°; λ = 626 nm for red devices and 460 nm for blue devices.
| Condition | Metric | Setfos | Dreapex TMM | Absolute difference |
|---|---|---|---|---|
| (a) | Spectral intensity / W·m⁻²·nm⁻¹·sr⁻¹ | 0.2608056 | 0.260805638 | 3.75e-08 |
| (a) | Luminance / cd·m⁻² | 1329.714 | 1329.71462 | 6.18e-04 |
| (b) | Spectral intensity / W·m⁻²·nm⁻¹·sr⁻¹ | 0.409756 | 0.409756072 | 7.19e-08 |
| (b) | Luminance / cd·m⁻² | 1982.942 | 1982.94265 | 6.46e-04 |
| (c) | Spectral intensity / W·m⁻²·nm⁻¹·sr⁻¹ | 0.05904198 | 0.0590419889 | 8.94e-09 |
| (c) | Luminance / cd·m⁻² | 132.4469 | 132.446957 | 5.68e-05 |
| (d) | Spectral intensity / W·m⁻²·nm⁻¹·sr⁻¹ | 0.04047742 | 0.0404774264 | 6.44e-09 |
| (d) | Luminance / cd·m⁻² | 99.01194 | 99.0119541 | 1.41e-05 |
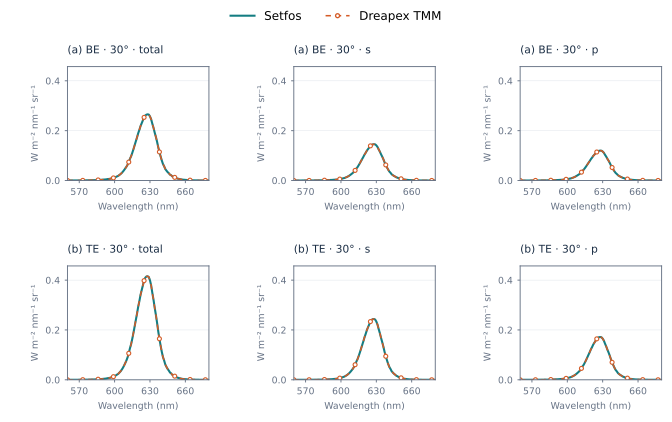
Figure 33. Red top and bottom emission: Spectrum at 30°
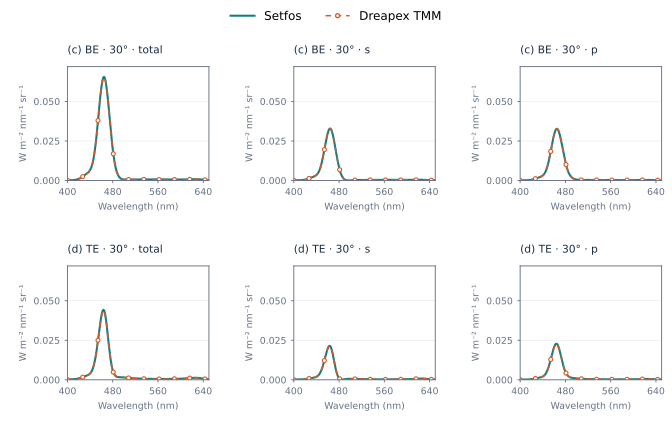
Figure 34. Blue top and bottom emission: Spectrum at 30°
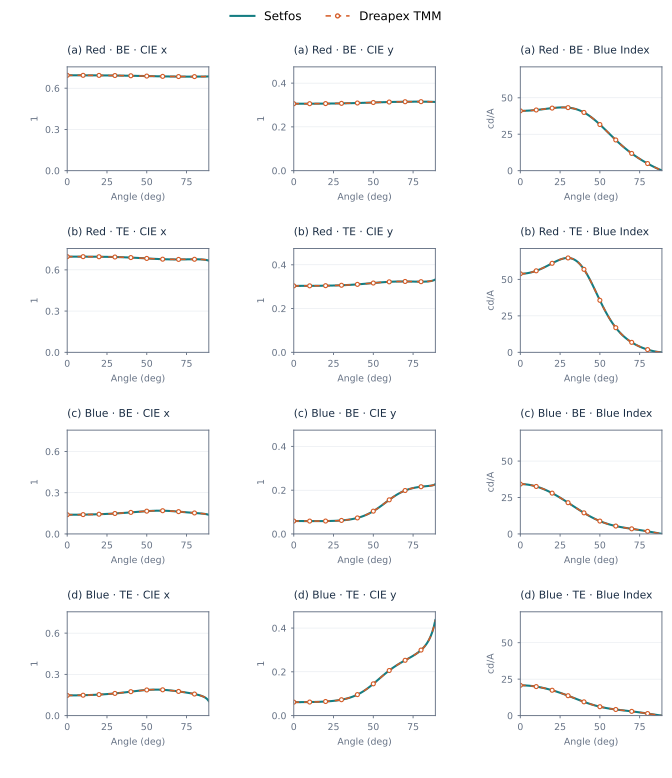
Figure 35. Top and bottom emission: CIE xy and Blue Index
All four devices use the same CIE 1931 2° observer and Linear interpolation (5 nm) color/photometry settings. The CIE xy column gives the larger absolute difference of x and y; the other columns give the maximum relative difference for each metric.
2.3.1 Angular metrics and color shift
Blue top-emission and two-emitter cases retain matching angles, photometry and dipole orientation. Select 0° as the angular-color-shift reference, linear interpolation (5 nm) and CIE 1931 2°. Color shift is assessed using the absolute Δu′v′ difference, with relative differences also reported.
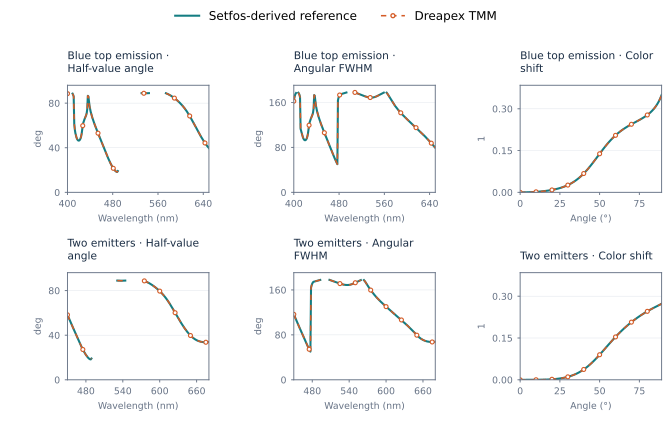
Figure 36. Angular metrics for blue and two-emitter cases
2.4 Physical and projected area
Setfos SpreadSource OFF corresponds to Physical area normalization in Dreapex TMM; ON corresponds to Projected area. Device parameters, emission spectra, current density and viewing angles remain matched. Coverage includes red and blue emission, two emitters, incoherent layers and birefringent structures.
| Configuration | Photometry / ppm | CE / ppm | Efficacy / ppm |
|---|---|---|---|
| Red / physical | 0.402689 | 0.402689 | 0.244164 |
| Red / projected | 0.588954 | 0.588954 | 0.244164 |
| Blue / physical | 0.499271 | 0.499271 | 0.373109 |
| Blue / projected | 0.549543 | 0.549543 | 0.373109 |
Representative numerical values. Red top-emitting device, θ = 60°.
| Condition | Metric | Setfos | Dreapex TMM | Absolute difference |
|---|---|---|---|---|
| Physical area | Radiance / W·m⁻²·sr⁻¹ | 2.151178 | 2.15117805 | 5.02e-08 |
| Physical area | Luminance / cd·m⁻² | 543.5601 | 543.560135 | 3.50e-05 |
| Physical area | Current efficiency / cd·A⁻¹ | 5.435601 | 5.43560135 | 3.50e-07 |
| Projected area | Radiance / W·m⁻²·sr⁻¹ | 4.302356 | 4.3023561 | 1.00e-07 |
| Projected area | Luminance / cd·m⁻² | 1087.12 | 1087.12027 | 2.70e-04 |
| Projected area | Current efficiency / cd·A⁻¹ | 10.8712 | 10.8712027 | 2.70e-06 |
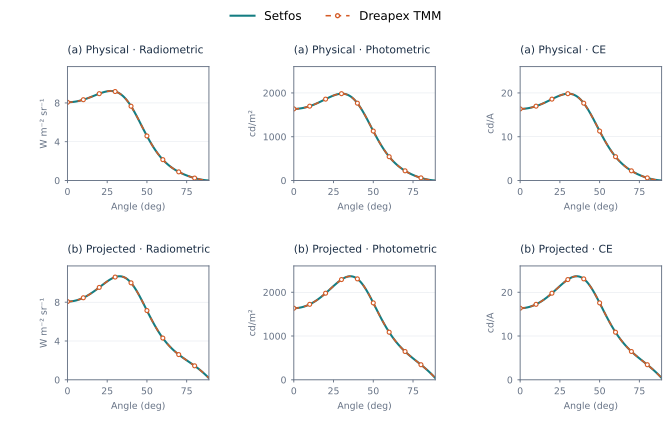
Figure 37. Red top emission: area normalization
2.5 Dipole orientation
The blue top-emitting device is evaluated with Isotropic, Parallel and Perpendicular dipoles, using the corresponding Dipole orientation options in Dreapex TMM. The s and p output polarizations correspond to TE and TM; they are distinct from dipole orientation.
| Orientation | total / ppm | s / ppm | p / ppm |
|---|---|---|---|
| (a) Isotropic | 0.600427 | 0.604392 | 0.610789 |
| (b) Parallel | 0.610285 | 0.608277 | 0.609514 |
| (c) Perpendicular | 0.612485 | 0.000000 | 0.612485 |
Representative numerical values. Blue top-emitting device, λ = 460 nm, θ = 30°.
| Condition | Metric | Setfos | Dreapex TMM | Absolute difference |
|---|---|---|---|---|
| (a) · total | Spectral intensity / W·m⁻²·nm⁻¹·sr⁻¹ | 0.04047742 | 0.0404774264 | 6.44e-09 |
| (a) · s | Spectral intensity / W·m⁻²·nm⁻¹·sr⁻¹ | 0.01980812 | 0.0198081178 | 2.22e-09 |
| (a) · p | Spectral intensity / W·m⁻²·nm⁻¹·sr⁻¹ | 0.02066931 | 0.0206693087 | 1.34e-09 |
| (b) · total | Spectral intensity / W·m⁻²·nm⁻¹·sr⁻¹ | 0.05806176 | 0.058061767 | 6.99e-09 |
| (b) · s | Spectral intensity / W·m⁻²·nm⁻¹·sr⁻¹ | 0.02971217 | 0.0297121767 | 6.67e-09 |
| (b) · p | Spectral intensity / W·m⁻²·nm⁻¹·sr⁻¹ | 0.02834959 | 0.0283495903 | 3.15e-10 |
| (c) · total | Spectral intensity / W·m⁻²·nm⁻¹·sr⁻¹ | 0.005308745 | 0.00530874536 | 3.57e-10 |
| (c) · s | Spectral intensity / W·m⁻²·nm⁻¹·sr⁻¹ | 0 | 0 | 0 |
| (c) · p | Spectral intensity / W·m⁻²·nm⁻¹·sr⁻¹ | 0.005308745 | 0.00530874536 | 3.57e-10 |
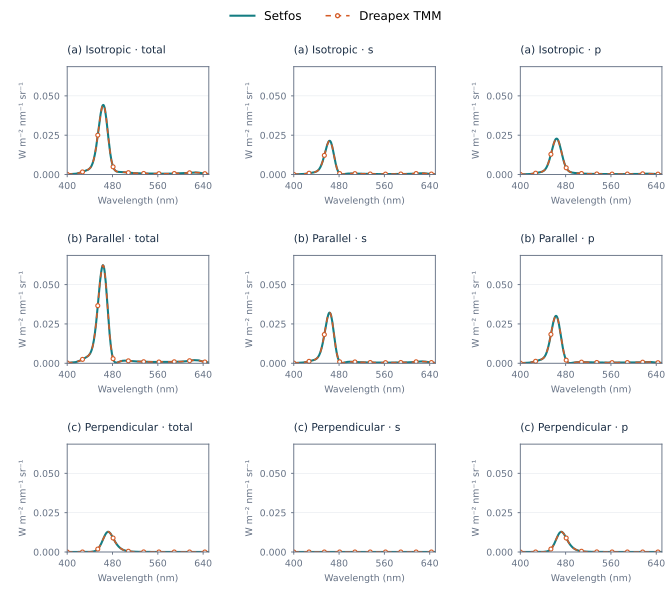
Figure 38. Blue top emission: dipole orientation, Spectrum at 30°
Perpendicular dipoles have no signal at normal emission. Chromaticity and spectral width at that point, and normal-referenced angular retention, are undefined and are not counted as zero-valued matches.