Baseline Results
Emission Simulation Benchmark Report
Baseline Device
The planar QLED baseline uses isotropic materials, an incoherent glass substrate and coherent thin films. The emitter is transparent with n = 1.78. Both simulations use identical layer dimensions, optical constants and emission spectra, with one Isotropic source at the QD center. Enable the Intensity detector in Dreapex TMM for the Spectrum comparison; s and p correspond to TE and TM.
Layer sequence (top to bottom): Air / Glass 1.1 mm / IZO-T 110 nm / PEDOT 35 nm / TFB 25 nm / QD 20 nm / ZnMgO 70 nm / IZO-B 150 nm / Ag 100 nm / Air. Glass has n = 1.52; both air boundaries have n = 1.
| Assessment | Compared values | Max. relative difference / ppm | Result |
|---|---|---|---|
| Spectrum | 32,670 | 0.611392 | Very small difference < 1 ppm |
| Power Dissipation | 46,566 | 0.114682 | Very small difference < 1 ppm |
| Mode | 312 | 0.577634 | Very small difference < 1 ppm |
1.1 Spectrum
Settings: 560–680 nm in 1 nm steps; 0–89° in 1° steps; q₀ = 1. Total, s and p agree within 1 ppm. Rows show 0°, 30° and 60°; differences cover the full wavelength and angle grid.
| total / ppm | s / ppm | p / ppm |
|---|---|---|
| 0.604799 | 0.604782 | 0.611392 |
Representative numerical values. λ = 626 nm; emission angles 0°, 30° and 60°.
| Condition | Metric | Setfos | Dreapex TMM | Absolute difference |
|---|---|---|---|---|
| 0° · total | Spectral intensity / W·m⁻²·nm⁻¹·sr⁻¹ | 0.299051 | 0.299051012 | 1.20e-08 |
| 0° · s | Spectral intensity / W·m⁻²·nm⁻¹·sr⁻¹ | 0.1495255 | 0.149525506 | 6.00e-09 |
| 0° · p | Spectral intensity / W·m⁻²·nm⁻¹·sr⁻¹ | 0.1495255 | 0.149525506 | 6.00e-09 |
| 30° · total | Spectral intensity / W·m⁻²·nm⁻¹·sr⁻¹ | 0.2929099 | 0.292909885 | 1.55e-08 |
| 30° · s | Spectral intensity / W·m⁻²·nm⁻¹·sr⁻¹ | 0.1602201 | 0.160220111 | 1.14e-08 |
| 30° · p | Spectral intensity / W·m⁻²·nm⁻¹·sr⁻¹ | 0.1326898 | 0.132689773 | 2.69e-08 |
| 60° · total | Spectral intensity / W·m⁻²·nm⁻¹·sr⁻¹ | 0.1131356 | 0.113135571 | 2.92e-08 |
| 60° · s | Spectral intensity / W·m⁻²·nm⁻¹·sr⁻¹ | 0.06257224 | 0.06257225 | 1.00e-08 |
| 60° · p | Spectral intensity / W·m⁻²·nm⁻¹·sr⁻¹ | 0.05056332 | 0.0505633208 | 8.35e-10 |
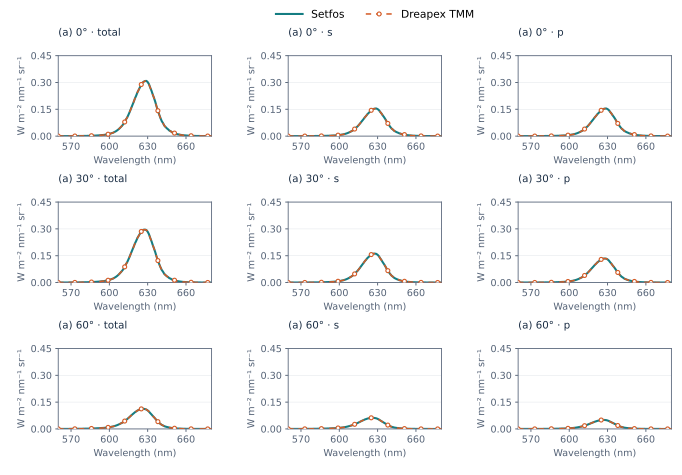
Figure 1. Baseline device (a) · Spectrum at 0°, 30° and 60° emission angles
1.2 Angular distributions
With the same baseline device, emission spectrum and q₀ = 1, angular distributions are compared from 0° to 89° in 1° steps. The first two rows show total, s and p at 610 nm and 626 nm; the third row shows emission integrated over 560–680 nm.
The angular curves at both wavelengths agree with Setfos. Maximum relative differences for all three wavelength-integrated channels are below 1 ppm.
| Assessment | total / ppm | s / ppm | p / ppm |
|---|---|---|---|
| Wavelength integral | 0.402368 | 0.448267 | 0.410253 |
Representative numerical values. Wavelength-integrated angular distribution; total / s / p.
| Condition | Metric | Setfos | Dreapex TMM | Absolute difference |
|---|---|---|---|---|
| 0° | total / W·m⁻²·sr⁻¹ | 7.095619 | 7.09561946 | 4.62e-07 |
| 0° | s / W·m⁻²·sr⁻¹ | 3.547809 | 3.54780973 | 7.31e-07 |
| 0° | p / W·m⁻²·sr⁻¹ | 3.547809 | 3.54780973 | 7.31e-07 |
| 30° | total / W·m⁻²·sr⁻¹ | 6.891568 | 6.89156907 | 1.07e-06 |
| 30° | s / W·m⁻²·sr⁻¹ | 3.761389 | 3.76138925 | 2.52e-07 |
| 30° | p / W·m⁻²·sr⁻¹ | 3.130179 | 3.13017982 | 8.15e-07 |
| 60° | total / W·m⁻²·sr⁻¹ | 2.789871 | 2.78987109 | 9.32e-08 |
| 60° | s / W·m⁻²·sr⁻¹ | 1.561425 | 1.56142522 | 2.23e-07 |
| 60° | p / W·m⁻²·sr⁻¹ | 1.228446 | 1.22844587 | 1.29e-07 |
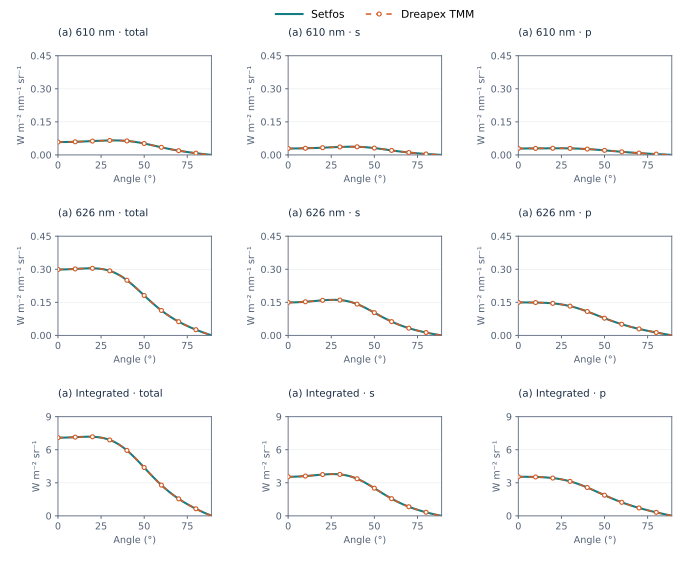
Figure 2. Baseline device (a) · Angular distributions, 610 nm, 626 nm and wavelength-integrated
1.3 CIE xy / Blue Index
The comparison uses the CIE 1931 2° observer, the 560–680 nm band, the total spectrum, a current density of 100 A/m² and the same device area. The Dreapex TMM color and photometry method is set to Linear interpolation (5 nm).
Under these settings, maximum absolute differences from Setfos are 4.77 × 10⁻⁸ for CIE x and 4.94 × 10⁻⁸ for CIE y; the maximum relative difference for Blue Index is 0.554 ppm. The figure covers 0–89°, with numerical values at 0°, 30° and 60° listed below.
| Assessment | Max. absolute difference | Max. relative difference / ppm |
|---|---|---|
| CIE x | 4.770997e-08 | 0.069605 |
| CIE y | 4.943288e-08 | 0.156865 |
| Blue Index | 1.027631e-05 | 0.553524 |
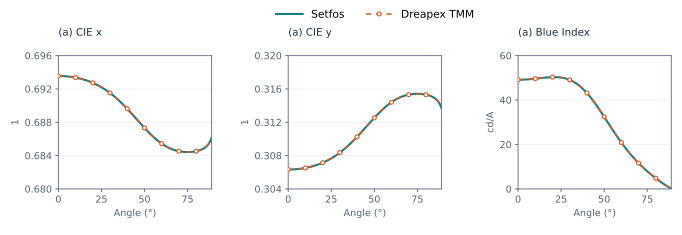
Figure 3. Baseline device (a) · CIE xy and Blue Index
| Angle | Assessment | Setfos | Dreapex TMM | Absolute difference |
|---|---|---|---|---|
| 0° | CIE x | 0.69355740 | 0.69355741 | 1.33e-08 |
| 0° | CIE y | 0.30633330 | 0.30633331 | 7.55e-09 |
| 0° | Blue Index / cd/A | 49.152250 | 49.152259 | 8.64e-06 |
| 30° | CIE x | 0.69151890 | 0.69151892 | 1.50e-08 |
| 30° | CIE y | 0.30836180 | 0.30836184 | 4.42e-08 |
| 30° | Blue Index / cd/A | 49.079900 | 49.079907 | 6.99e-06 |
| 60° | CIE x | 0.68544230 | 0.68544235 | 4.77e-08 |
| 60° | CIE y | 0.31440900 | 0.31440903 | 3.32e-08 |
| 60° | Blue Index / cd/A | 20.891960 | 20.891966 | 6.26e-06 |
1.4 FWHM / Peak wavelength
Using the same baseline device and emission spectrum with a 1 nm wavelength step, the comparison covers total spectral full width at half maximum (FWHM) and total, s and p peak wavelengths over 0–89°.
FWHM is labeled Different definitions: Dreapex TMM uses the full half-maximum envelope, while the reference uses the contiguous half-maximum region containing the main peak. The maximum absolute difference in this single-peak baseline is approximately 4.94 × 10⁻⁶ nm. All 270 peak wavelengths across the three polarization channels match Setfos.
| Assessment | Max. absolute difference / nm | Max. relative difference / ppm | Result |
|---|---|---|---|
| FWHM · total | 4.943278e-06 | 0.236146 | Different definitions |
| Peak wavelength · total | 0 | 0.000000 | Very small difference < 1 ppm |
| Peak wavelength · s | 0 | 0.000000 | Very small difference < 1 ppm |
| Peak wavelength · p | 0 | 0.000000 | Very small difference < 1 ppm |
Representative numerical values. Peak wavelength and FWHM of the same total spectrum; FWHM retains each product’s definition.
| Condition | Metric | Setfos | Dreapex TMM | Absolute difference |
|---|---|---|---|---|
| 0° | Peak wavelength / nm | 629 | 629 | 0 |
| 0° | FWHM / nm | 20.46301 | 20.4630104 | 4.04e-07 |
| 30° | Peak wavelength / nm | 628 | 628 | 0 |
| 30° | FWHM / nm | 20.78734 | 20.787338 | 2.04e-06 |
| 60° | Peak wavelength / nm | 626 | 626 | 0 |
| 60° | FWHM / nm | 21.82931 | 21.8293083 | 1.74e-06 |
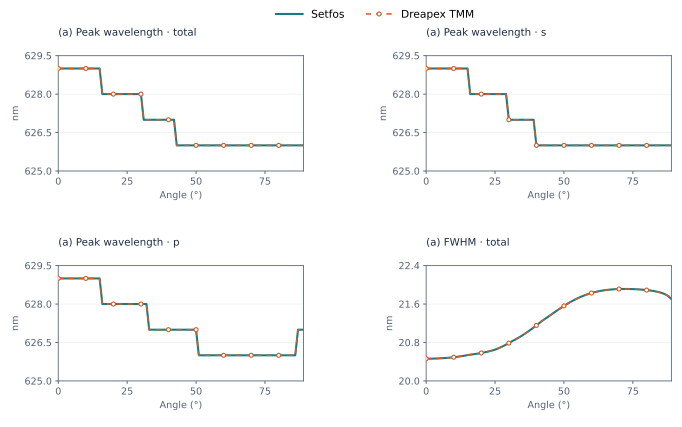
Figure 4. Baseline device (a) · Peak wavelength and spectral FWHM
1.5 Photometry, efficiency and normalized spectra
The baseline device uses Linear interpolation (5 nm), the CIE 1931 2° observer, Physical area normalization and a current density of 100 A/m² in Dreapex TMM. The corresponding photometric values, current efficiency and luminous efficacy agree with Setfos. Angular retention and decrease are referenced to normal emission.
Each polarization component of the normalized spectrum is referenced to its own peak. The maximum absolute differences in angular retention and decrease are both 0.0000461 percentage points.
| Metric | Max. absolute difference | Relative difference / ppm |
|---|---|---|
| Luminous intensity per physical area / cd/m² | 0.0006547654 | 0.529340 |
| Current efficiency / cd/A | 6.547654e-06 | 0.529340 |
| Luminous efficacy / lm/W | 4.917602e-05 | 0.228021 |
| Angular retention / pp | 4.608706e-05 | — |
| Angular decrease / pp | 4.608706e-05 | — |
| Metric | total / ppm | s / ppm | p / ppm |
|---|---|---|---|
| Normalized spectrum | 0.485589 | 0.491504 | 0.486050 |
| Peak intensity | 0.433338 | 0.451080 | 0.514724 |
Representative numerical values. Baseline device at 0°, 30° and 60°.
| Condition | Metric | Setfos | Dreapex TMM | Absolute difference |
|---|---|---|---|---|
| 0° | Luminance / cd·m⁻² | 1505.697 | 1505.6974 | 3.96e-04 |
| 0° | Current efficiency / cd·A⁻¹ | 15.05697 | 15.056974 | 3.96e-06 |
| 0° | Luminous efficacy / lm·W⁻¹ | 212.201 | 212.200979 | 2.10e-05 |
| 30° | Luminance / cd·m⁻² | 1513.437 | 1513.43706 | 6.31e-05 |
| 30° | Current efficiency / cd·A⁻¹ | 15.13437 | 15.1343706 | 6.31e-07 |
| 30° | Luminous efficacy / lm·W⁻¹ | 219.607 | 219.607037 | 3.70e-05 |
| 60° | Luminance / cd·m⁻² | 656.8622 | 656.862291 | 9.12e-05 |
| 60° | Current efficiency / cd·A⁻¹ | 6.568622 | 6.56862291 | 9.12e-07 |
| 60° | Luminous efficacy / lm·W⁻¹ | 235.4454 | 235.445391 | 8.70e-06 |
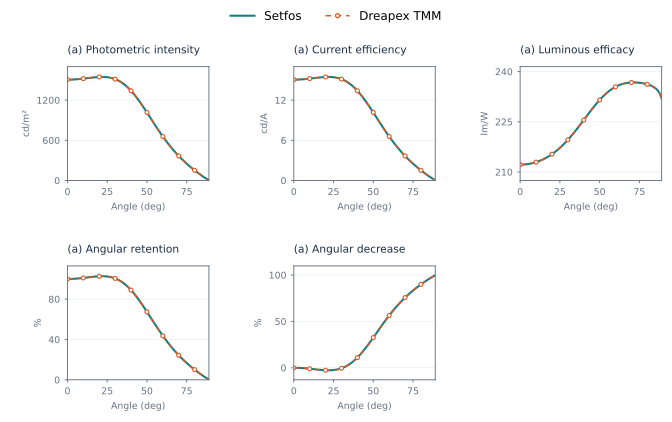
Figure 5. Baseline device: photometry, efficiency and angular retention
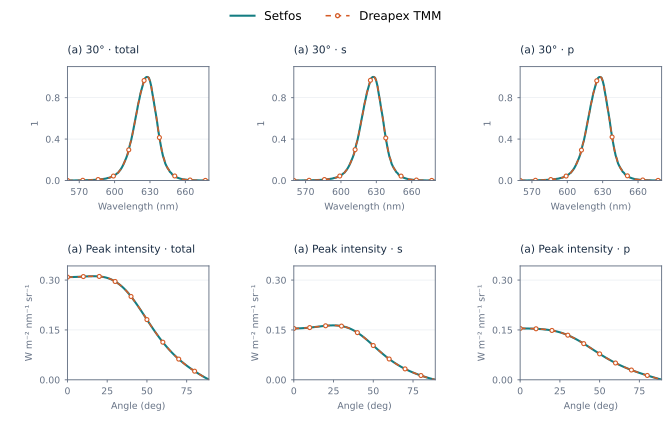
Figure 6. Baseline device: normalized spectra and peak intensity
1.6 Power Dissipation
Total, s and p are compared for dissipated power, top radiation and bottom radiation over 560–680 nm in 10 nm steps and n_eff = 0–4 in steps of 0.01. Emission settings match Spectrum; the figure shows 610 nm. All nine channels are below 1 ppm outside registered critical points.
| Assessment | total / ppm | s / ppm | p / ppm |
|---|---|---|---|
| Dissipated power | 0.114682 | 0.114682 | 0.114682 |
| Top radiation | 0.114682 | 0.114682 | 0.114682 |
| Bottom radiation | 0.114682 | 0.114682 | 0.114682 |
Representative numerical values. λ = 610 nm, n_eff = 0.50.
| Condition | Metric | Setfos | Dreapex TMM | Absolute difference |
|---|---|---|---|---|
| total | Dissipated / W·m⁻²·nm⁻¹ | 0.452818496 | 0.452818548 | 5.19e-08 |
| s | Dissipated / W·m⁻²·nm⁻¹ | 0.249228975 | 0.249229003 | 2.86e-08 |
| p | Dissipated / W·m⁻²·nm⁻¹ | 0.203589521 | 0.203589545 | 2.33e-08 |
| total | Top radiation / W·m⁻²·nm⁻¹ | 0.426534996 | 0.426535045 | 4.89e-08 |
| s | Top radiation / W·m⁻²·nm⁻¹ | 0.235065743 | 0.23506577 | 2.70e-08 |
| p | Top radiation / W·m⁻²·nm⁻¹ | 0.191469253 | 0.191469275 | 2.20e-08 |
| total | Bottom radiation / W·m⁻²·nm⁻¹ | 9.37759566e-05 | 9.37759674e-05 | 1.08e-11 |
| s | Bottom radiation / W·m⁻²·nm⁻¹ | 4.46296641e-05 | 4.46296692e-05 | 5.12e-12 |
| p | Bottom radiation / W·m⁻²·nm⁻¹ | 4.91462925e-05 | 4.91462982e-05 | 5.64e-12 |
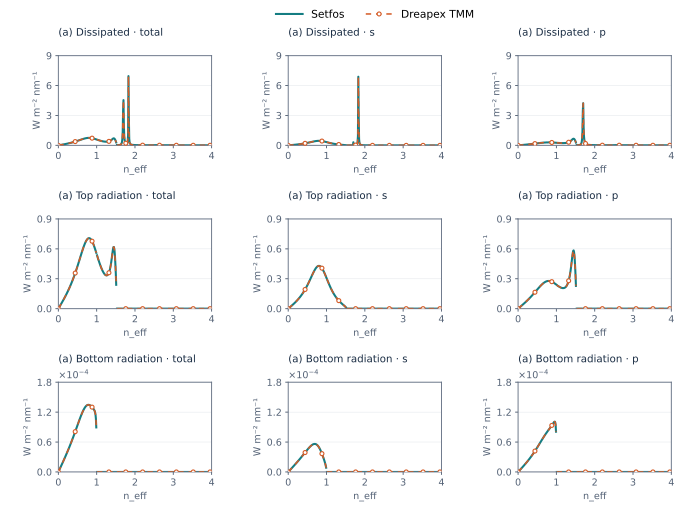
Figure 7. Baseline device (a) · Power Dissipation at 610 nm
1.7 Mode
The same device is evaluated at independent wavelengths from 560 to 680 nm in 10 nm steps, with an intrinsic lifetime of 10 ns and q₀ = 1 or 0.37. The Purcell factor, effective quantum efficiency, lifetime, seven mode fractions and decay-rate quantities are all below 1 ppm. The Modes column reports the largest difference across the seven fractions; the figure uses q₀ = 0.37. Mode results are polarization-summed.
| q₀ | F / ppm | Decay enh. / ppm | q / ppm | τ / ppm | Modes / ppm |
|---|---|---|---|---|---|
| 0.37 | 0.027518 | 0.011082 | 0.016436 | 0.011082 | 0.577634 |
| 1 | 0.027518 | 0.027518 | 0.000000 | 0.027518 | 0.561199 |
Representative numerical values. λ = 610 nm, Isotropic; absolute differences for percentages are in percentage points.
| Condition | Metric | Setfos | Dreapex TMM | Absolute difference |
|---|---|---|---|---|
| q₀ = 0.37 | Purcell factor | 1.14145686 | 1.14145686 | 4.75e-09 |
| q₀ = 0.37 | Quantum efficiency / % | 40.1333623 | 40.1333622 | 9.99e-08 |
| q₀ = 0.37 | Lifetime / ns | 9.50264091 | 9.50264093 | 1.59e-08 |
| q₀ = 1 | Purcell factor | 1.14145686 | 1.14145686 | 4.75e-09 |
| q₀ = 1 | Quantum efficiency / % | 100 | 100 | 0 |
| q₀ = 1 | Lifetime / ns | 8.76073406 | 8.7607341 | 3.64e-08 |
| q₀ = 0.37 | Top outcoupling / % | 15.8466763 | 15.8466763 | 4.45e-09 |
| q₀ = 0.37 | Waveguide modes / % | 6.12053721 | 6.12053722 | 1.08e-08 |
| q₀ = 0.37 | Absorption loss / % | 1.93419764 | 1.93419751 | 1.33e-07 |
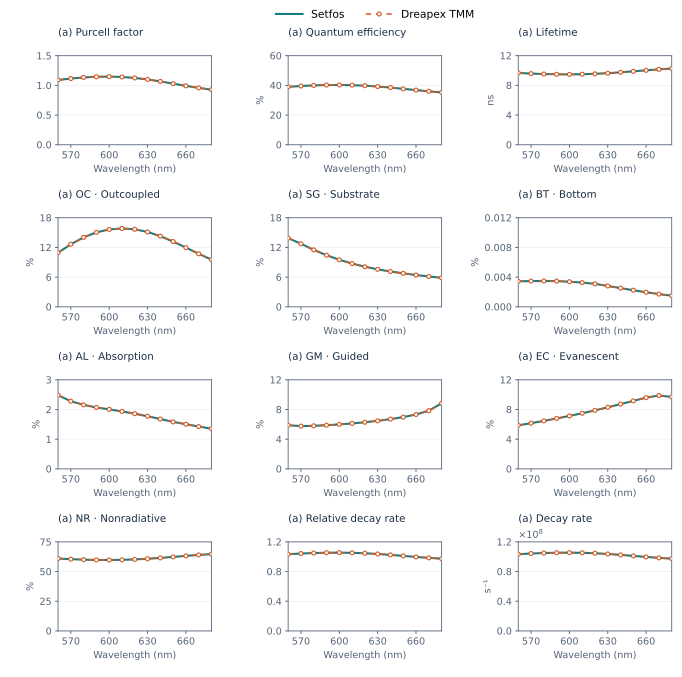
Figure 8. Baseline device (a) · Mode, Isotropic, q₀ = 0.37
1.8 Angular assessments and internal distributions
The baseline device is retained over 0°–89°. Select Normalized angular distribution, Half-value angle, Angular FWHM and Lambertian factor in Dreapex TMM, with matching wavelengths and total, s and p channels. The figure compares actual product outputs against independent references derived from Setfos spectra.
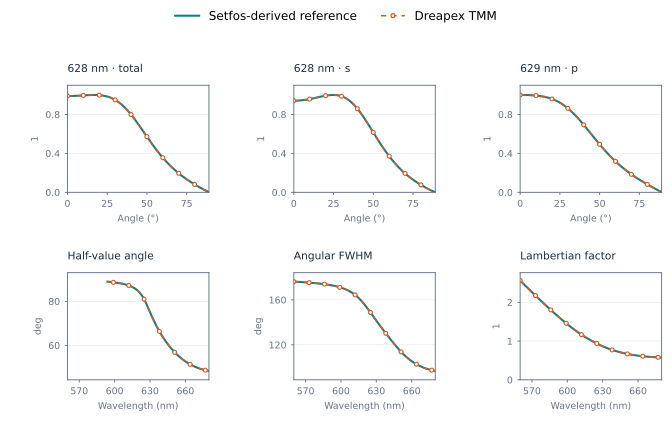
Figure 9. Angular assessments for the baseline device
1.8.1 Validation across angular cases
The 26 configurations provide 1,248,085 valid compared values. Maximum absolute differences are 0.000159° for angular quantities and 1.85×10⁻⁷ for angular color shift Δu′v′. ³ Metrics without a valid half-maximum crossing, normal signal or color are excluded as applicable.
| Metric | Valid values | Max. absolute difference | Max. relative difference / ppm |
|---|---|---|---|
| Normalized angular distribution | 1,189,620 | 9.7982e-07 | 0.981801 |
| Half-value angle / ° | 19,852 | 8.01299e-05 | 2.67028 |
| Angular FWHM / ° | 24,741 | 0.000158888 | 1.4187 |
| Lambertian factor | 11,712 | 0.000101416 | 0.50615 |
| Angular color shift Δu′v′ | 2,160 | 1.84265e-07 | 557061 |
1.8.2 Internal angular distributions
Select Internal angular distribution in Dreapex TMM with an isotropic emitting layer; the angle is measured inside that layer. The baseline, birefringent TFB, birefringent ZnMgO and dispersive isotropic-emitter configurations provide 111,624 valid values against independent references derived from native dissipated-power data. Maximum total, s and p differences are all below 0.115 ppm. TOC, SUB, WVG and ABS denote outcoupling, substrate, waveguide and absorption-related components. ⁴ This comparison excludes 0° and registered critical coordinates.
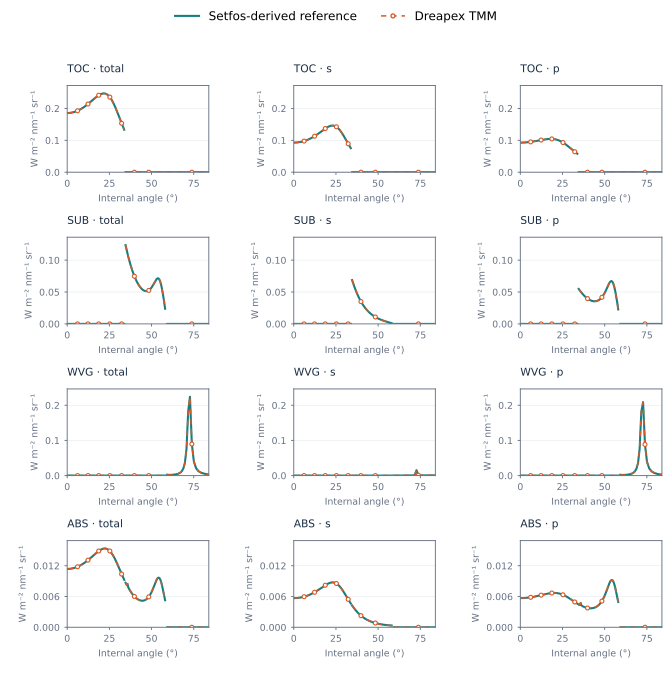
Figure 10. Baseline internal angular distributions at 610 nm