Two Emitters and Thickness Sweeps
Emission Simulation Benchmark Report
2.6 Two emitters
Two emitters are configured in the emissive layer, retaining their individual emission spectra, dipole orientations, positions and conversion efficiencies. Multiplication factor in Dreapex TMM corresponds to EmInt, and Conversion efficiency to ConvEff; conversion efficiency must not be substituted for the intrinsic quantum efficiency used in Mode. The figure uses the top-emitting device with Physical area normalization.
| Configuration | total / ppm | s / ppm | p / ppm |
|---|---|---|---|
| Physical area | 0.609962 | 0.600446 | 0.609979 |
| Projected area | 0.608034 | 0.597580 | 0.599359 |
| Sweep | Configurations | Max. difference / ppm |
|---|---|---|
| Bottom: multiplication factor | 10 | 0.606678 |
| Bottom: conversion efficiency | 10 | 0.583909 |
| Bottom: joint parameter grid | 100 | 0.114682 |
| Top: multiplication factor | 10 | 0.595442 |
| Top: conversion efficiency | 10 | 0.597322 |
Representative numerical values. Top-emitting two-source device; 530 nm and 626 nm represent the two spectral bands.
| Condition | Metric | Setfos | Dreapex TMM | Absolute difference |
|---|---|---|---|---|
| 0° · 530 nm | Spectral intensity / W·m⁻²·nm⁻¹·sr⁻¹ | 0.006771603 | 0.00677160343 | 4.27e-10 |
| 0° · 626 nm | Spectral intensity / W·m⁻²·nm⁻¹·sr⁻¹ | 0.3472625 | 0.347262568 | 6.81e-08 |
| 60° · 530 nm | Spectral intensity / W·m⁻²·nm⁻¹·sr⁻¹ | 0.01283547 | 0.0128354745 | 4.50e-09 |
| 60° · 626 nm | Spectral intensity / W·m⁻²·nm⁻¹·sr⁻¹ | 0.08317187 | 0.0831718774 | 7.39e-09 |
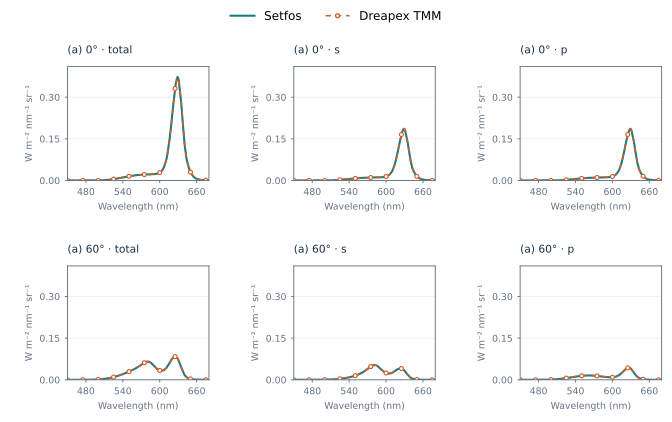
Figure 39. Two emitters: Spectrum at 0° and 60°
The emitter-weight and conversion-efficiency sweeps contain 140 configurations, covering total, s and p spectra, wavelength-integrated output, photometry and current efficiency. All compared outputs differ by less than 1 ppm.
2.7 Layer-thickness sweeps
The bottom- and top-emitting devices are evaluated by varying IZO-B alone and IZO-T together with IZO-B. Single-layer and synchronous scans use 5–200 nm in 5 nm steps; the synchronous scan assigns equal thickness to both layers. Independent scans use a 40 × 40 grid over the same interval. In Dreapex TMM, select the Thickness parameters of the specified layers and configure the single-parameter, synchronous or independent combinations.
| Sweep | Configurations | Max. difference / ppm |
|---|---|---|
| Bottom / one layer | 40 | 0.611750 |
| Bottom / synchronous | 40 | 0.608954 |
| Bottom / independent grid | 1600 | 0.591066 |
| Top / one layer | 40 | 0.600474 |
| Top / synchronous | 40 | 0.597537 |
| Top / independent grid | 1600 | 0.593125 |
Representative numerical values. θ = 0°; single-layer IZO-B and synchronous IZO-T = IZO-B sweeps.
| Condition | Metric | Setfos | Dreapex TMM | Absolute difference |
|---|---|---|---|---|
| BE · 5 nm | Radiance / W·m⁻²·sr⁻¹ | 5.764589 | 5.76459004 | 1.04e-06 |
| BE · 100 nm | Radiance / W·m⁻²·sr⁻¹ | 3.551805 | 3.55180534 | 3.36e-07 |
| BE · 200 nm | Radiance / W·m⁻²·sr⁻¹ | 0.1892974 | 0.189297415 | 1.49e-08 |
| BE · 100/100 nm | Radiance / W·m⁻²·sr⁻¹ | 3.173348 | 3.17334862 | 6.18e-07 |
| TE · 5 nm | Radiance / W·m⁻²·sr⁻¹ | 7.53963 | 7.53963133 | 1.33e-06 |
| TE · 100 nm | Radiance / W·m⁻²·sr⁻¹ | 2.360703 | 2.36070314 | 1.38e-07 |
| TE · 200 nm | Radiance / W·m⁻²·sr⁻¹ | 0.3274543 | 0.327454303 | 3.22e-09 |
| TE · 100/100 nm | Radiance / W·m⁻²·sr⁻¹ | 2.360703 | 2.36070314 | 1.38e-07 |
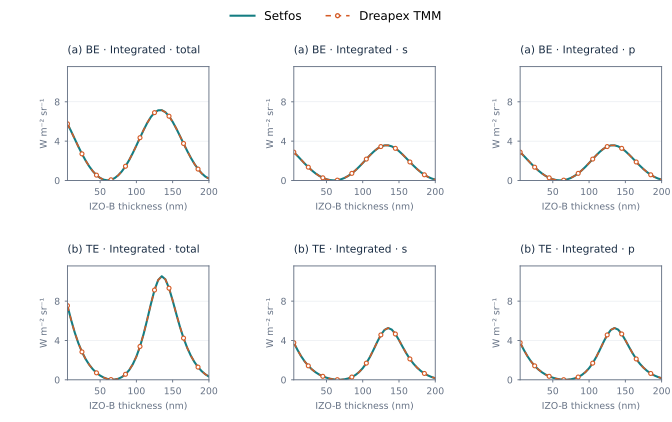
Figure 40. IZO-B thickness sweep: wavelength-integrated output
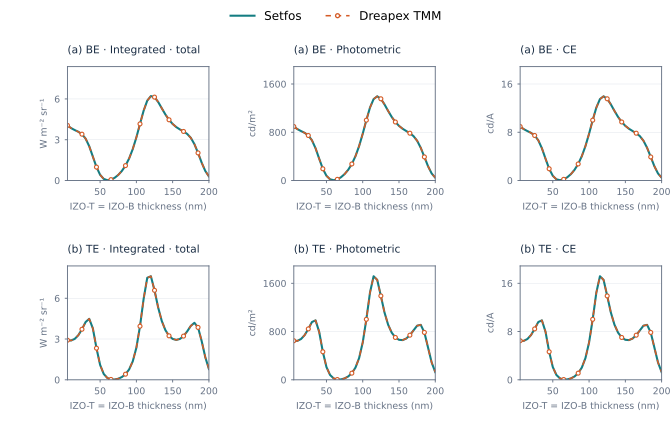
Figure 41. Synchronous two-layer thickness sweep
The single-layer and synchronous scans compare total, s and p Spectrum outputs, together with integrated and photometric quantities. The independent grids compare integrated total, s and p output, photometry and current efficiency. All directly compared outputs across 3,360 configurations differ by less than 1 ppm.