Hemisphere Integration, Efficiency and Weighted Modes
Emission Simulation Benchmark Report
2.11 Hemisphere integration and external quantum efficiency
This section assesses hemisphere-integrated quantities and photon/electron ratios associated with the spectra. Dreapex TMM currently has no native integrating-sphere or EQE result page; this section evaluates quantities derived from the output spectra. The original area setting, current density and linear interpolation (5 nm) photometry are retained. The directional photon/electron ratio has units sr⁻¹ (native column: EQE), while the Lambertian estimate is dimensionless. Both are distinguished from hemisphere-integrated EQE.
| Assessment | Coverage | Measured difference |
|---|---|---|
| Common-domain integral | 27 cases × 6 outputs, 0°–89° | Maximum < 0.171 ppm |
| Directional and Lambertian estimates | 12,261 pairs | Up to about 1.67 ppm in other cases; 0.6845% for emission-position distributions |
| Near-hemisphere vs native sphere | 27 cases, 0.1° grid to 89.999° | Radiometric total up to 0.12903%; photometry / current efficiency up to 0.25811% |
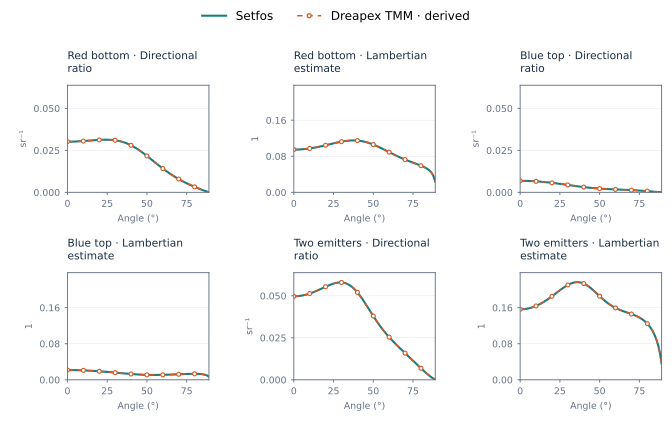
Figure 49. Spectral checks of directional EQE and Lambertian estimates
With a 0.1° angular grid extending to 89.999°, the differences do not consistently converge; the cause remains under investigation. White emission W, Ws and Wp currently have no corresponding product outputs.
2.12 Spectrally weighted Mode
Select Weighted Average in the Mode wavelength settings of Dreapex TMM and retain the emission spectrum, intrinsic quantum efficiency and intrinsic lifetime. Set up the IZO-B single-thickness sweep, independent IZO-B / IZO-T sweep, and synchronized two-thickness sweep. The synchronized sweep gives both layers the same thickness. The bottom-emission cases enable the top incoherent Glass1 substrate; top-emission cases disable Glass1 and keep all enabled films coherent. The single-thickness sweep is 5–200 nm in 5 nm steps. Independent and synchronized two-thickness sweeps use 5–195 nm in 10 nm steps. Wavelengths are 560–680 nm in 1 nm steps; the original emission spectrum spans 550–690 nm. Two-thickness plots fix IZO-T = 105 nm and sweep IZO-B, while the numerical table covers all combinations.
| Configuration | Runs | Lifetime / ppm | Efficiency / ppm | Decay rate / ppm | Max. modes / ppm |
|---|---|---|---|---|---|
| Bottom / single thickness | 40 | 1956.64 | 418.575 | 426.514 | 119.662 |
| Bottom / two thicknesses | 400 | 2227.85 | 418.575 | 473.248 | 215.949 |
| Bottom / synchronized | 20 | 1644.16 | 418.575 | 426.484 | 76.2621 |
| Top / single thickness | 40 | 6283.35 | 418.575 | 430.312 | 143.561 |
| Top / two thicknesses | 400 | 6718.87 | 418.575 | 438.458 | 359.622 |
| Top / synchronized | 20 | 3500.32 | 418.575 | 429.009 | 123.687 |
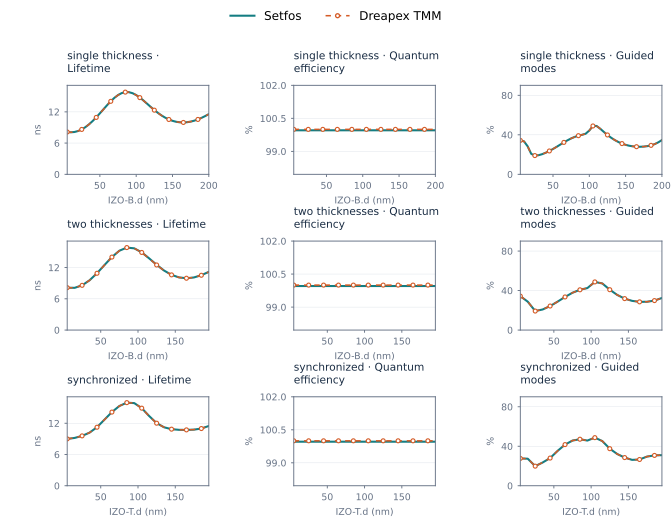
Figure 50. Bottom emission weighted Mode
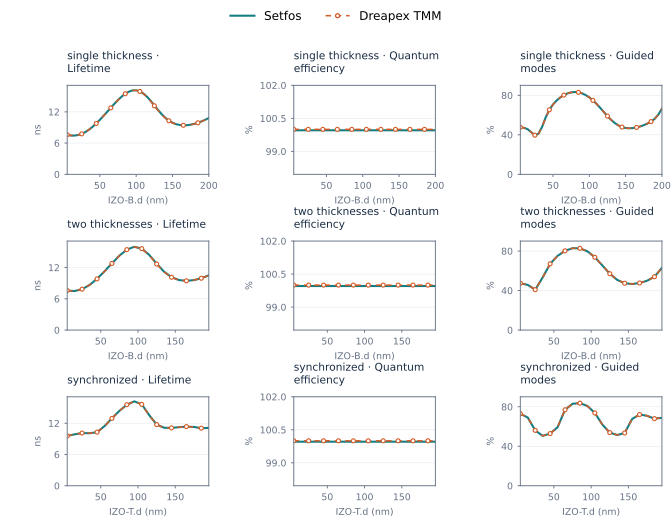
Figure 51. Top emission weighted Mode
The 920 single-emitter configurations provide 8,740 compared values. Maximum differences are 0.671887% for lifetime and 359.622 ppm for mode channels. The spectral-average definitions and wavelength ranges differ, so these results are listed separately. The two-emitter cases lack the complete required emission-spectrum range and are excluded from this numerical comparison. Mean Purcell factors and absolute mode powers are outside this section’s comparison scope.