Hole Transport Layers and Thickness Effects in Perovskite Solar Cells
Optical Simulation of Planar CH3NH3PbI3 Perovskite Solar Cells
Author: Nguyen Duc Cuong
Journal: VNU Journal of Science: Mathematics–Physics 35(3), 94–102 (2019) · Comparison targets: ideal photocurrents on p. 101 and the thickness curves in Figure 7c
The hole transport layer of a planar perovskite solar cell lies between the transparent electrode and the perovskite. Its absorption reduces the light reaching the active layer, while layer thickness also changes interference and absorption in the stack. Cuong studied methylammonium lead iodide (MAPbI₃) devices, comparing PEDOT:PSS and copper-doped nickel oxide (Cu:NiOₓ) hole transport layers and calculating how perovskite thickness affects ideal photocurrent.
Page 101 reports the ideal current for a 210 nm absorber in both structures; Figure 7c shows how current varies with thickness. This case uses the material refractive indices provided in Figure 2 to run baseline calculations and 20–500 nm thickness sweeps in Dreapex TMM. Current calculation assumes one electron for each photon absorbed by MAPbI₃, corresponding to 100% internal quantum efficiency.
Structure
Light enters Glass from air, then passes through the transparent FTO electrode, hole transport layer HEL, MAPbI3, electron transport layer PCBM, and LiF toward the Al back electrode. Both Top Medium and Bottom Medium are air with n of 1. Build the PEDOT:PSS structure first, following the incident-light direction below.
| Layer | Thickness | Layer state |
|---|---|---|
| Glass | 1 mm | Inco. |
| FTO | 580 nm | None |
| HEL | 40 nm | None |
| MAPbI3 | 210 nm | None |
| PCBM | 50 nm | None |
| LiF | 0.5 nm | None |
| Al | 120 nm | None |
FTO is the fluorine-doped tin oxide transparent electrode. PEDOT:PSS is the hole transport material poly(3,4-ethylenedioxythiophene):polystyrene sulfonate; PCBM is a fullerene derivative used for electron transport. HEL uses PEDOT:PSS in the first structure.
Material refractive indices provided in the paper (Figure 2): FTO · PEDOT:PSS · Cu:NiOx · MAPbI3 · PCBM
The paper does not provide refractive indices for LiF or Al. Obtain these data separately for 300–1000 nm.
Each refractive index file contains wavelength in nm, refractive index n, and extinction coefficient k. The five files are extracted from Figure 2 at 5 nm intervals over 300–1000 nm, with reading resolution of approximately 0.006 in n and k.
Open Structure and Add the seven layers. Set Glass to Constant, n of 1.5, k of 0, and enable Inco.. The paper does not specify the glass optical boundary; this case assumes nonabsorbing glass.
For other layers select File, Upload their materials, and use Linear for Interpolation; HEL uses PEDOT:PSS. Disable all Emis. and Tran. switches. Set surrounding media to Constant, named Air-incidence and Air-transmission, with n of 1 and bottom k of 0.

The screenshot's MAPbI3 and the download mapbi3.nk contain the same data. After upload, the material field displays the filename.
Solar Spectrum
Current integration uses the AM1.5G spectrum from the official Stanford transfer matrix template cited by the paper, retaining its original intensity. AM1.5G denotes the global tilted-plane solar spectrum at air mass 1.5.
Optical Settings
Open Optics and enable Reflectance (R), Transmittance (T), Absorptance (A), and Layer Absorption under Propagation. Both structures use the settings below.
| UI field | Setting |
|---|---|
Wavelength Mode | Sweep |
From (nm) | 300 |
To (nm) | 1000 |
Step (nm) | 1 |
Incident Angle | 0° |
Polarization Ratio (p-polarization) | 0.5 |
Cone Angle | Off |
Incident Spectrum | Off |
A polarization ratio of 0.5 gives equal s and p contributions. Material data are linearly interpolated onto the 1 nm calculation grid. With Incident Spectrum disabled, results are absorption fractions; the solar spectrum is used in the subsequent current integration.

Optimizer messages about missing optimization objectives and variables do not prevent Run or Sweep in this case.Baseline Current for Two Hole Transport Layers
Optical current density expresses the current corresponding to sunlight absorbed by the active layer under ideal collection. This case assumes that each photon absorbed by MAPbI₃ produces one collected electron; mA/cm² means milliamperes per square centimeter of device area. The paper uses this convention for its predicted short-circuit current at 100% internal quantum efficiency. Actual short-circuit current also depends on carrier recombination and charge collection.
PEDOT:PSS Structure
Click Run. After completion, open Layer Absorption and select Line. Deselect the other layers in the legend to display only the absorption spectrum of the 210 nm MAPbI3 layer.
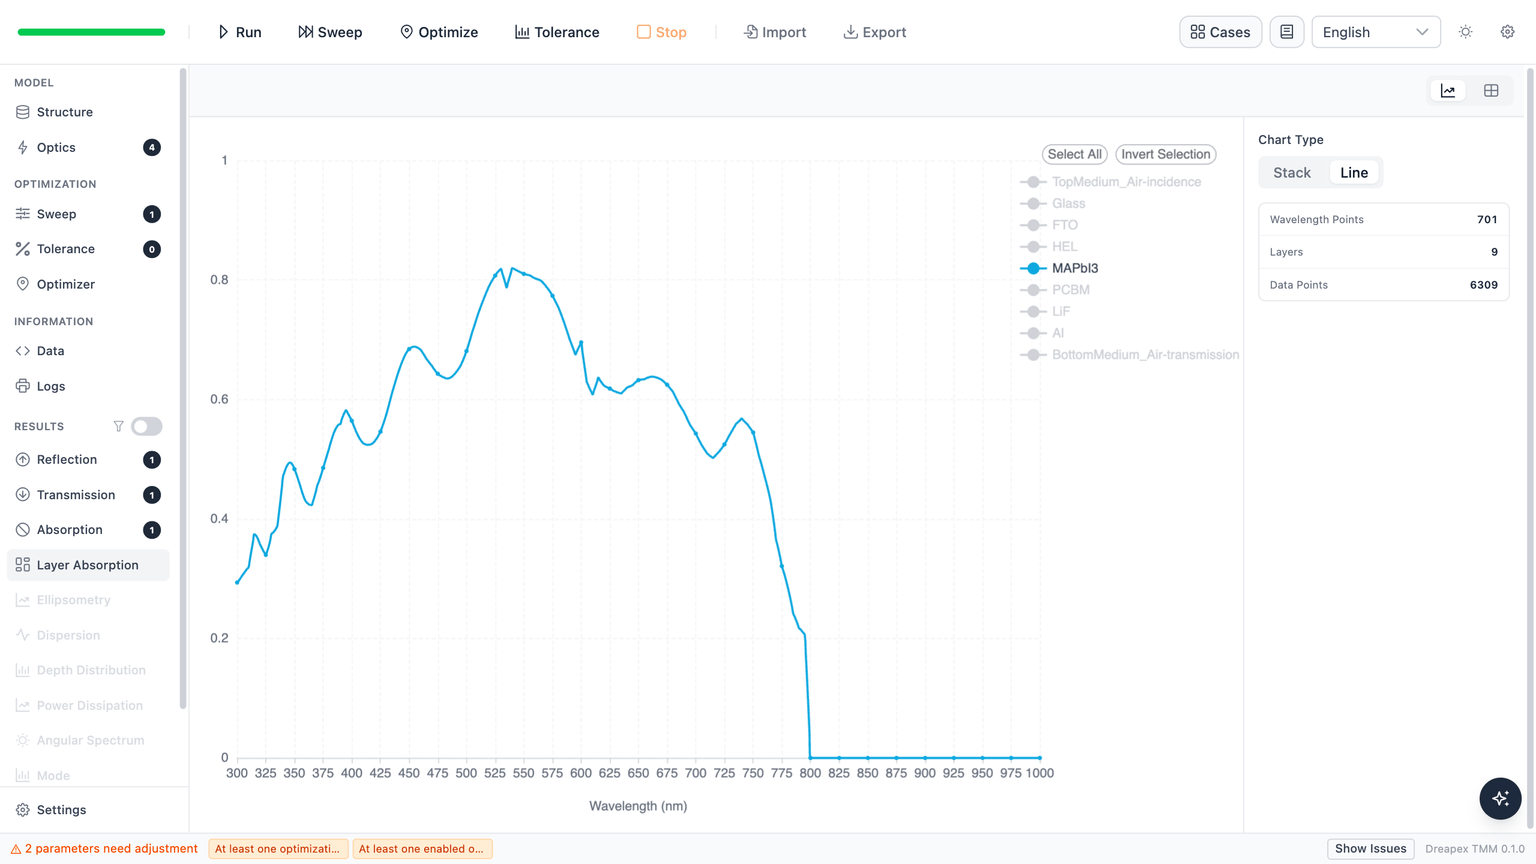
This figure shows simulation results; the paper provides no corresponding figure.
Dreapex TMM’s Layer Absorption gives the absorption fraction at each wavelength. This case calculates current after exporting the MAPbI3 spectrum: dividing the AM1.5G spectral power by the photon energy at each wavelength gives the incident photon flux; multiplying by MAPbI3 absorption gives the absorbed photon flux. Integration over wavelength and multiplication by the elementary charge give the optical current density used for comparison:
is optical current density under the ideal collection assumption above, in mA/cm²; is the dimensionless MAPbI3 absorption fraction; is AM1.5G spectral power density in W/m²/nm. is wavelength in nm and is wavelength in m.
Multiply the template's solar spectrum values in mW/cm²/nm by 10 to obtain . The factor 0.1 converts the integrated A/m² to mA/cm².
The elementary charge , Planck constant , and vacuum speed of light are C, J·s, and m/s. Linearly interpolate the solar spectrum onto the 1 nm grid and apply trapezoidal integration over 300–1000 nm.
Dreapex TMM simulation data: MAPbI3 absorption spectra for both structures
This structure gives 16.46 mA/cm², compared with 16.59 mA/cm² on paper p. 101, a relative difference of −0.80%.
Cu:NiOx Structure
Return to Structure and change only HEL thickness and material. Retain the baseline values for all other layers, including the 210 nm MAPbI3 thickness.
| Change | PEDOT:PSS structure | Cu:NiOx structure |
|---|---|---|
| HEL thickness | 40 nm | 15 nm |
| HEL material | PEDOT:PSS | Cu:NiOx |

Click Run again and retain only MAPbI3 in Layer Absorption → Line. The same spectrum and integration procedure give 17.86 mA/cm², compared with 17.97 mA/cm² in the paper, a relative difference of −0.64%.
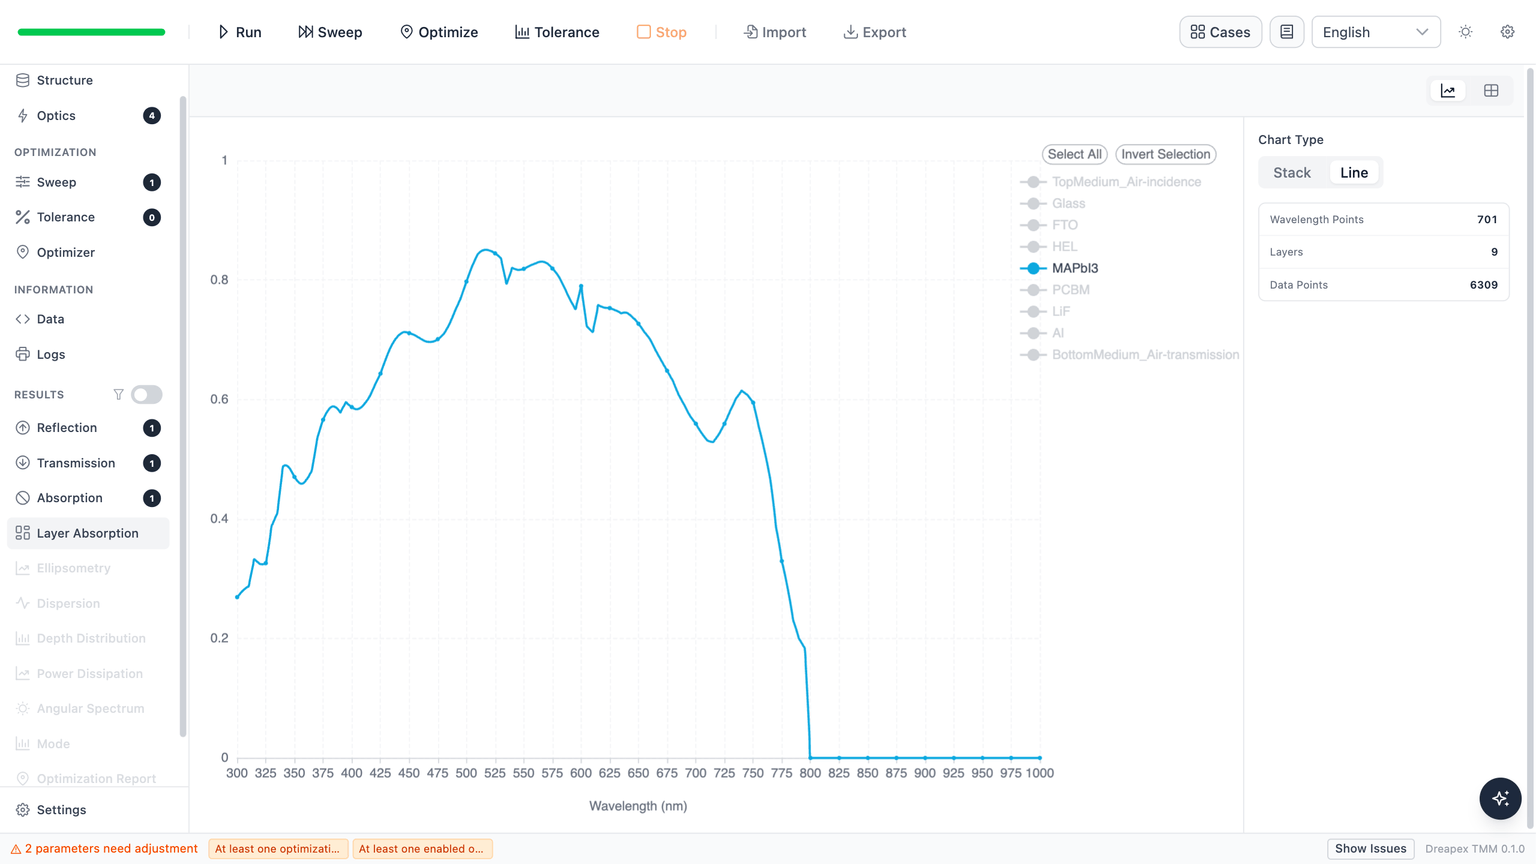
This figure shows simulation results; the paper provides no corresponding figure.
| HEL condition, MAPbI3 210 nm | Paper text, mA/cm² | Dreapex TMM, mA/cm² | Relative difference |
|---|---|---|---|
| PEDOT:PSS 40 nm | 16.59 | 16.46 | −0.80% |
| Cu:NiOx 15 nm | 17.97 | 17.86 | −0.64% |
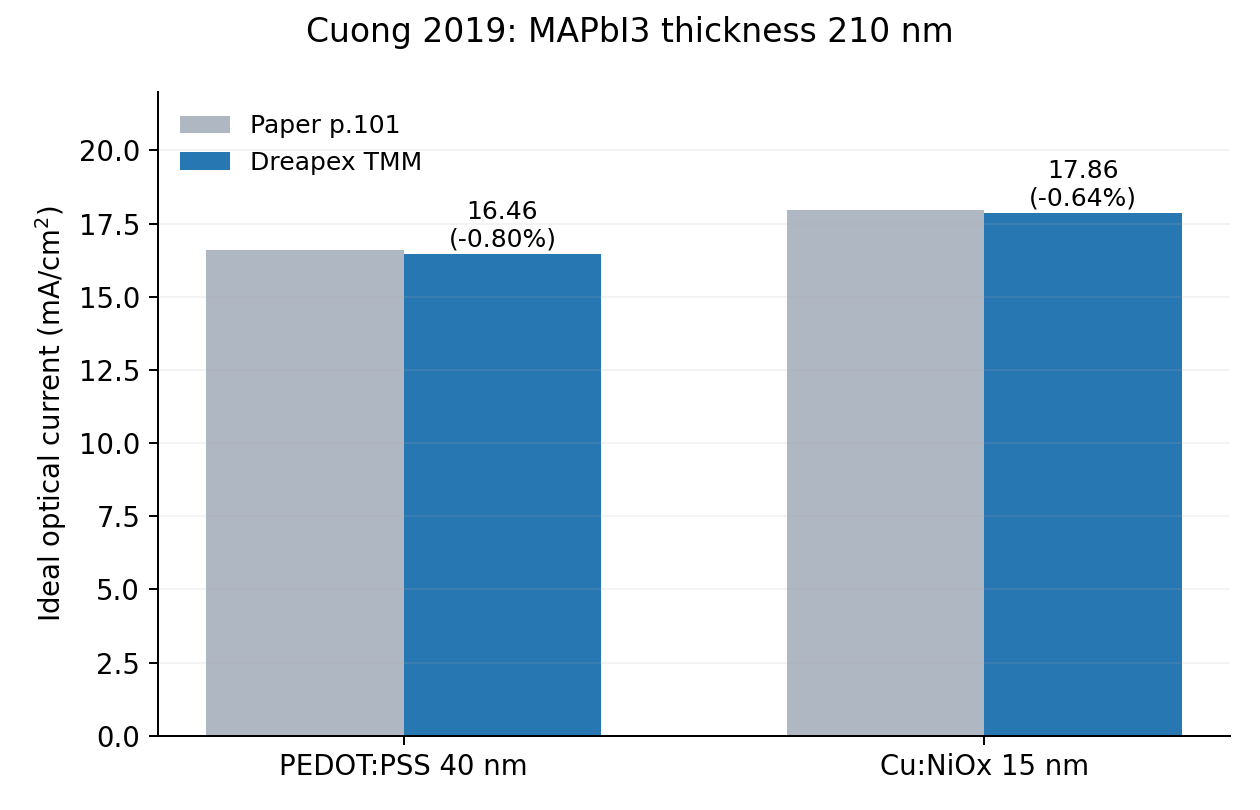
Paper text and Dreapex TMM simulation comparison data: two baseline currents
The calculated currents differ by 1.40 mA/cm². With the same integration, HEL parasitic absorption corresponds to 1.97 mA/cm² for PEDOT:PSS and 0.32 mA/cm² for Cu:NiOx. Changing the hole transport layer also changes interface reflection and interference, so the HEL absorption difference is not directly equal to the active-layer current gain.
Perovskite Thickness and Current (Figure 7c)
Thickness Sweep with Cu:NiOx
Retain Cu:NiOx at 15 nm and keep all non-active layers fixed. Open Sweep, use Add to create one sweep item, enable its row, disable Sync, and use the following settings.
| UI field | Setting |
|---|---|
Type | Single |
Parameter | structure / MAPbI3 / thickness |
From | 20 |
To | 500 |
Sampling | Step |
Step | 20 |
The MAPbI3 thickness unit is nm, giving 25 combinations from 20 to 500 nm at 20 nm intervals.

Click Sweep in the toolbar. After completion, open Layer Absorption, select Heatmap, and set Layer to MAPbI3. The horizontal axis is wavelength, the vertical axis is absorber thickness, and color indicates active-layer absorption. Click Export CSV to save the spectra for each thickness.
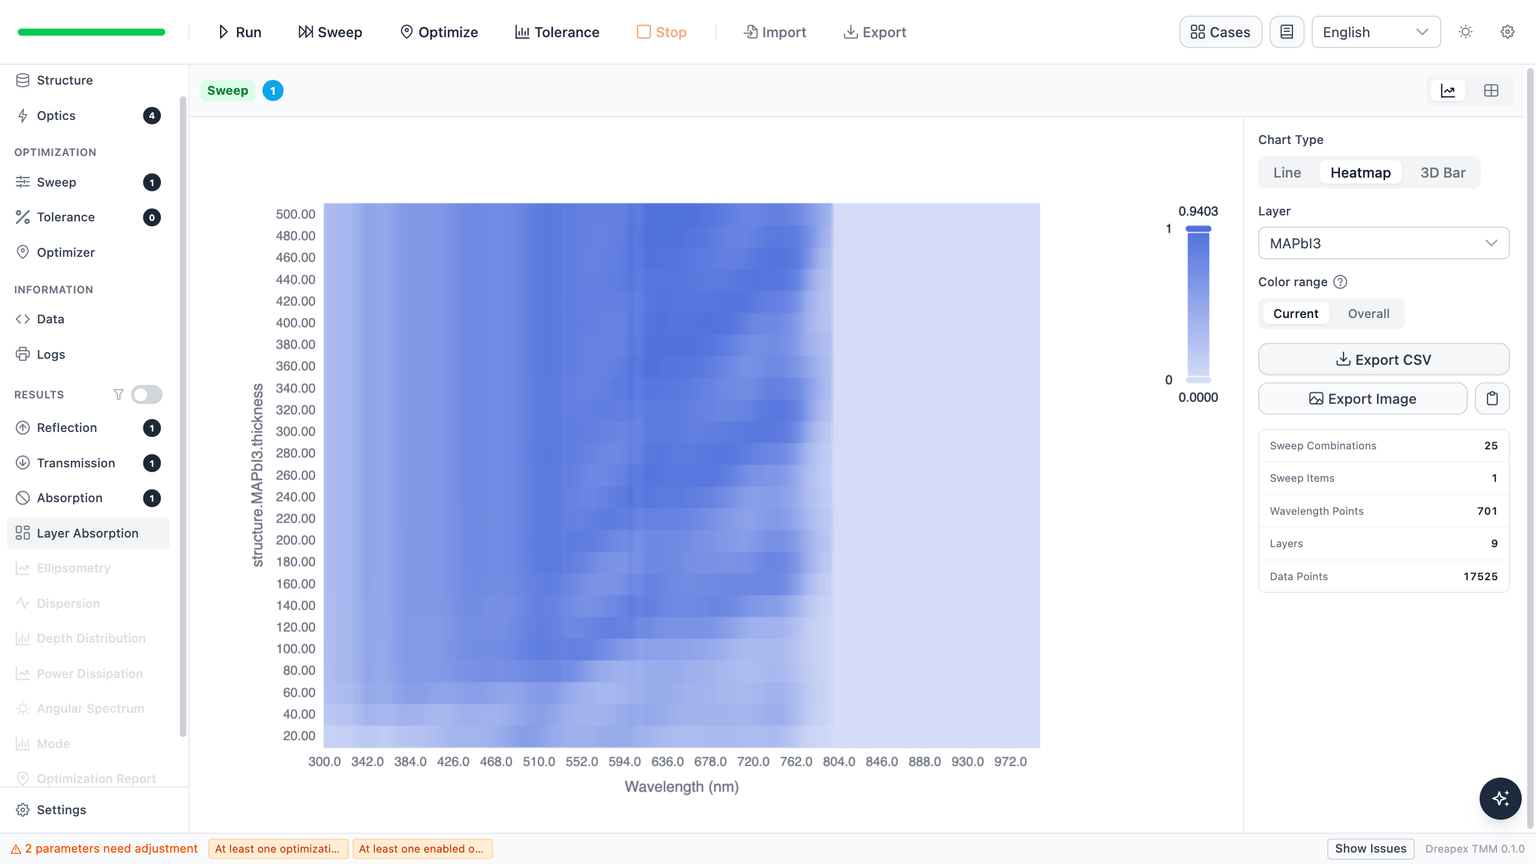
This figure shows simulation results; the paper provides no corresponding figure.
Thickness Sweep with PEDOT:PSS
Return to Structure and change HEL back to PEDOT:PSS 40 nm. Retain the same MAPbI3 sweep item and all optical settings. Open Sweep, verify the range, and run Sweep again from the toolbar.

Select Heatmap and MAPbI3 in Layer Absorption and use Export CSV to save the second set of spectra.

This figure shows simulation results; the paper provides no corresponding figure.
Thickness Curve Comparison
Apply the baseline integration equation to each thickness's MAPbI3 spectrum to obtain the solid curves below. Open symbols are data read from Figure 7c, with uncertainty of approximately 0.2 mA/cm². Points obscured by the legend or unresolved curves are excluded from comparison.
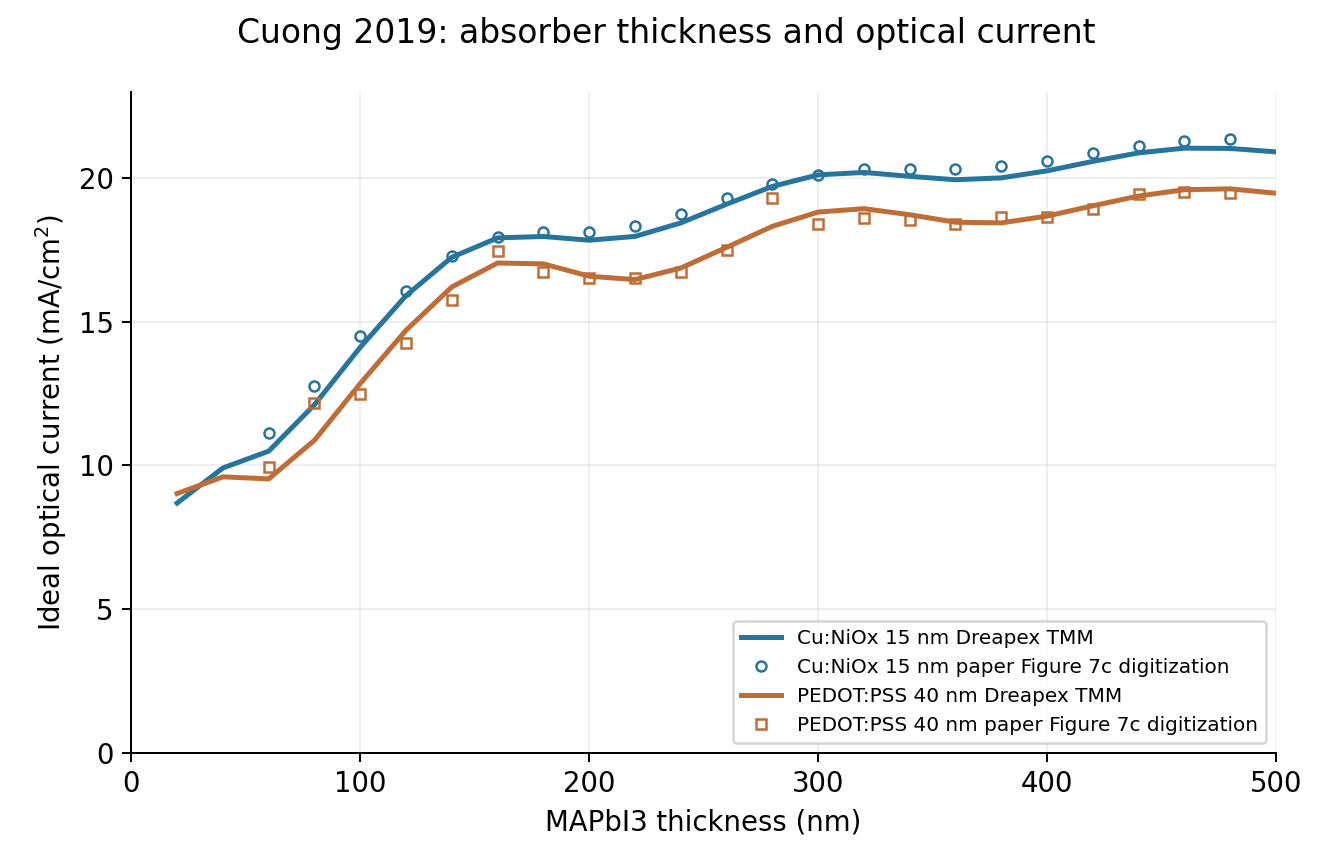
Across 20–100 nm, current increases overall with MAPbI3 thickness in both structures; thicker absorbers show interference oscillations. Across the readable paper points included in the statistics from 60 to 480 nm, the Cu:NiOx structure gives higher current than PEDOT:PSS, consistent with the paper. Errors over this range are listed below.
| Hole transport layer | Root-mean-square error, mA/cm² | Maximum local difference, mA/cm² |
|---|---|---|
| Cu:NiOx | 0.32 | 0.63 |
| PEDOT:PSS | 0.43 | 1.31 |
Digitized paper and Dreapex TMM simulation comparison data: Cu:NiOx thickness sweep · PEDOT:PSS thickness sweep
Deviation Notes
- Five materials' n and k are digitized from Figure 2, with an original 5 nm sampling interval and approximately 0.006 single-pixel resolution. The 1 nm calculation grid is linear interpolation. Baseline currents are 0.80% and 0.64% below the paper values.
- The paper does not specify the glass optical boundary. This case uses 1 mm incoherent glass with n of 1.5, k of 0, and air on both sides. Separately sourced LiF and Al data may affect absolute current and the positions of thickness extrema.
- Figure 7c reading uncertainty is approximately 0.2 mA/cm²; points below 60 nm are excluded from error statistics. The maximum local sweep difference is 1.31 mA/cm².
Back to Case Studies · Next: One-Dimensional Microcavity Thickness Optimization in a Top-Emitting Micro-OLED