Light Harvesting and Parasitic Absorption in Perovskite Solar Cells
Optical properties and limiting photocurrent of thin-film perovskite solar cells
Authors: James M. Ball, Samuel D. Stranks et al.
Journal: Energy & Environmental Science 8, 602–609 (2015) · Comparison targets: Figure 4a light harvesting; Figure 4c and p. 606 optical losses
In a thin-film perovskite solar cell, the transparent electrode, absorber, hole transport layer, and metal back electrode jointly determine where incident light is absorbed. Ball et al. studied methylammonium lead iodide (MAPbI₃) devices using measured complex refractive indices and the transfer matrix method to separate active-region absorption, parasitic absorption, and reflection and transmission losses, then calculate the ideal photocurrent limit.
Figure 4a gives active-region light-harvesting efficiency (LHE); Figure 4c separates optical losses. This case reconstructs the default supplementary structure in Dreapex TMM and compares its light-harvesting spectra and loss currents with the supplementary calculation and paper text. Ideal current assumes one electron per photon absorbed in the active region.
Structure
Light enters the glass from air and passes through the layers below toward the Au back electrode. Both Top Medium and Bottom Medium are air with refractive index 1. Layer names and thicknesses follow the default supplementary configuration; glass is incoherent and the other layers are coherent.
| Layer | Thickness | Layer state |
|---|---|---|
| SodaLime | 2000 nm | Inco. |
| SnO2 | 28 nm | None |
| SiO2 | 23 nm | None |
| FTO | 340 nm | None |
| FTema | 29 nm | None |
| TPema | 41 nm | None |
| Perov | 492 nm | None |
| SpOxema | 253 nm | None |
| Au | 30 nm | None |
Perov is the MAPbI₃ absorber, and FTO is the fluorine-doped tin oxide transparent electrode. FTema and TPema are effective-medium layers at the FTO/TiO₂ and TiO₂/MAPbI₃ interfaces; SpOxema is the doped Spiro-OMeTAD hole transport layer. Use the supplement's refractive index n and extinction coefficient k directly for the effective-medium layers.
Obtain refractive index data from n_k data.csv in the supplementary ZIP. Save each material as a three-column file: wavelength in nm, refractive index n, and extinction coefficient k. Paper data: Perov refractive index file is also available directly.
Open Structure and Add the table's nine layers. Select File, Upload each material, and set Interpolation to Linear. Enable Inco. only for SodaLime; disable Emis. and Tran. everywhere. Set the surrounding media to Constant, named Air-in and Air-out, with n of 1 and bottom k of 0.

Material and Spectrum Inputs
- Dispersion data for all nine layers cover 301–899 nm at 1 nm intervals. The Perov download comes from the Ball entry at refractiveindex.info, whose mirror uses CC0. All 599 points match the original supplement.
- Current integration uses
AM15 spectrum.csvfrom the same ZIP, with spectral power density in mW/cm²/nm. Its full-spectrum integral is approximately 100.037 mW/cm²; retain the original intensity without renormalizing.
The download perov.nk and the screenshot's Perov material use the same data.
Optical Settings
Open Optics and enable Reflectance (R), Transmittance (T), Absorptance (A), and Layer Absorption under Propagation. The first two measure light leaving the device; the other two provide total and individual-layer absorption.
| UI field | Setting |
|---|---|
Wavelength Mode | Sweep |
From (nm) | 340 |
To (nm) | 795 |
Step (nm) | 1 |
Incident Angle | 0° |
Polarization Ratio (p-polarization) | 0.5 |
Cone Angle | Off |
Incident Spectrum | Off |
A polarization ratio of 0.5 gives equal s and p contributions. With Incident Spectrum disabled, results are optical fractions relative to incident power; solar weighting is applied separately during current integration.

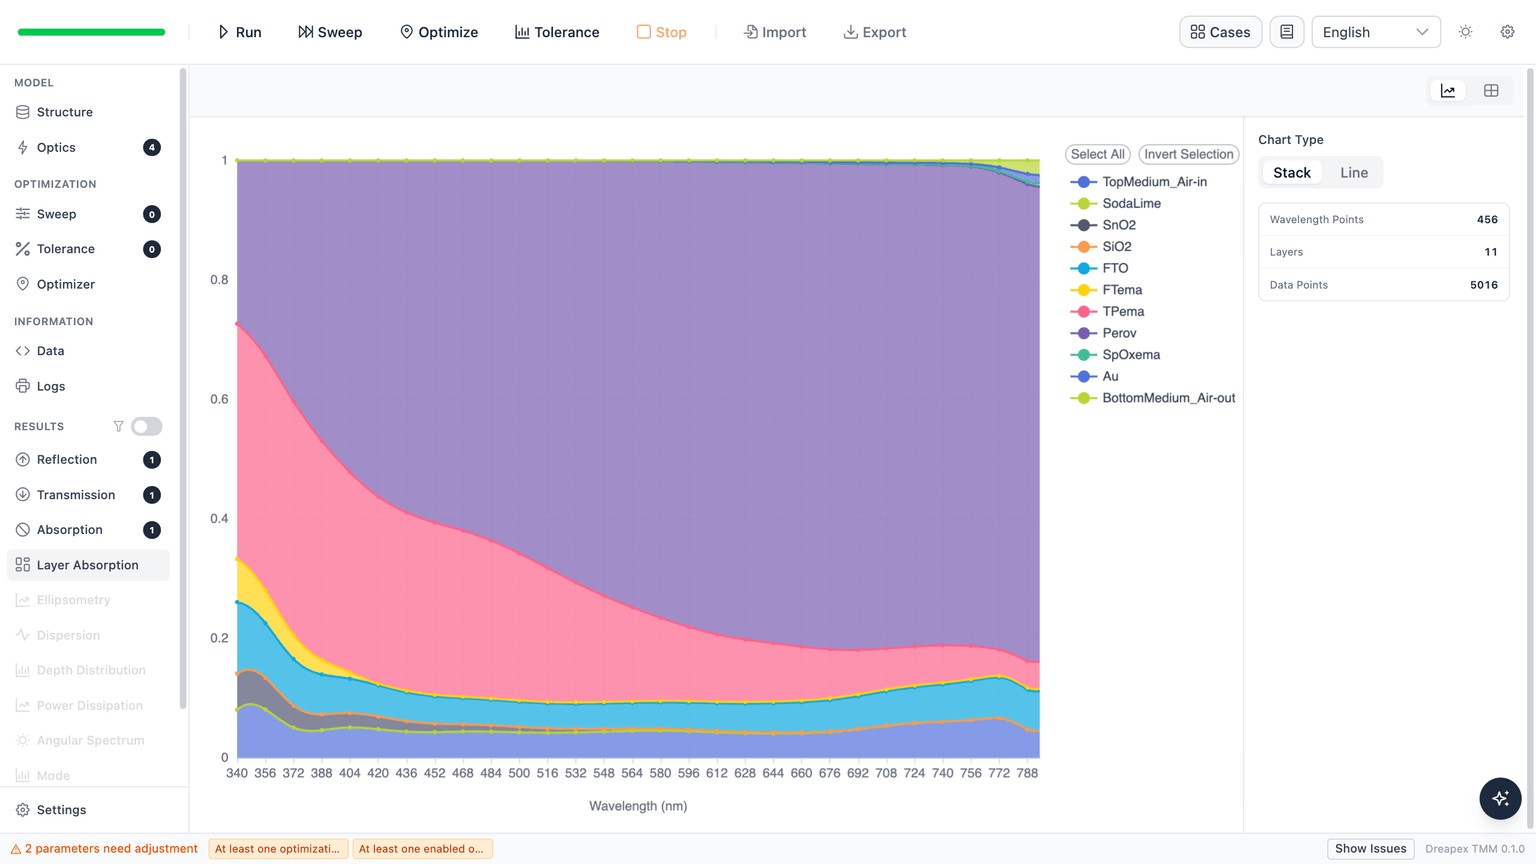
Optimizer parameters that need adjustment. These messages do not prevent Run in this case.Click Run in the toolbar. After completion, open Layer Absorption and select Stack to display the individual-layer absorption fractions together.
Light-Harvesting Spectra and Optical Loss Comparison
Active-Region Absorption Spectrum (Figure 4a)
The authors define light-harvesting efficiency (LHE) as the sum of TPema and Perov absorption. These two layers form the model's active region. The following screenshot shows layer absorption from this Run.
Read reflectance R and transmittance T from their respective result pages, selecting Total in both. The following pages retain the original fractions on the same incident-power basis as layer absorption.
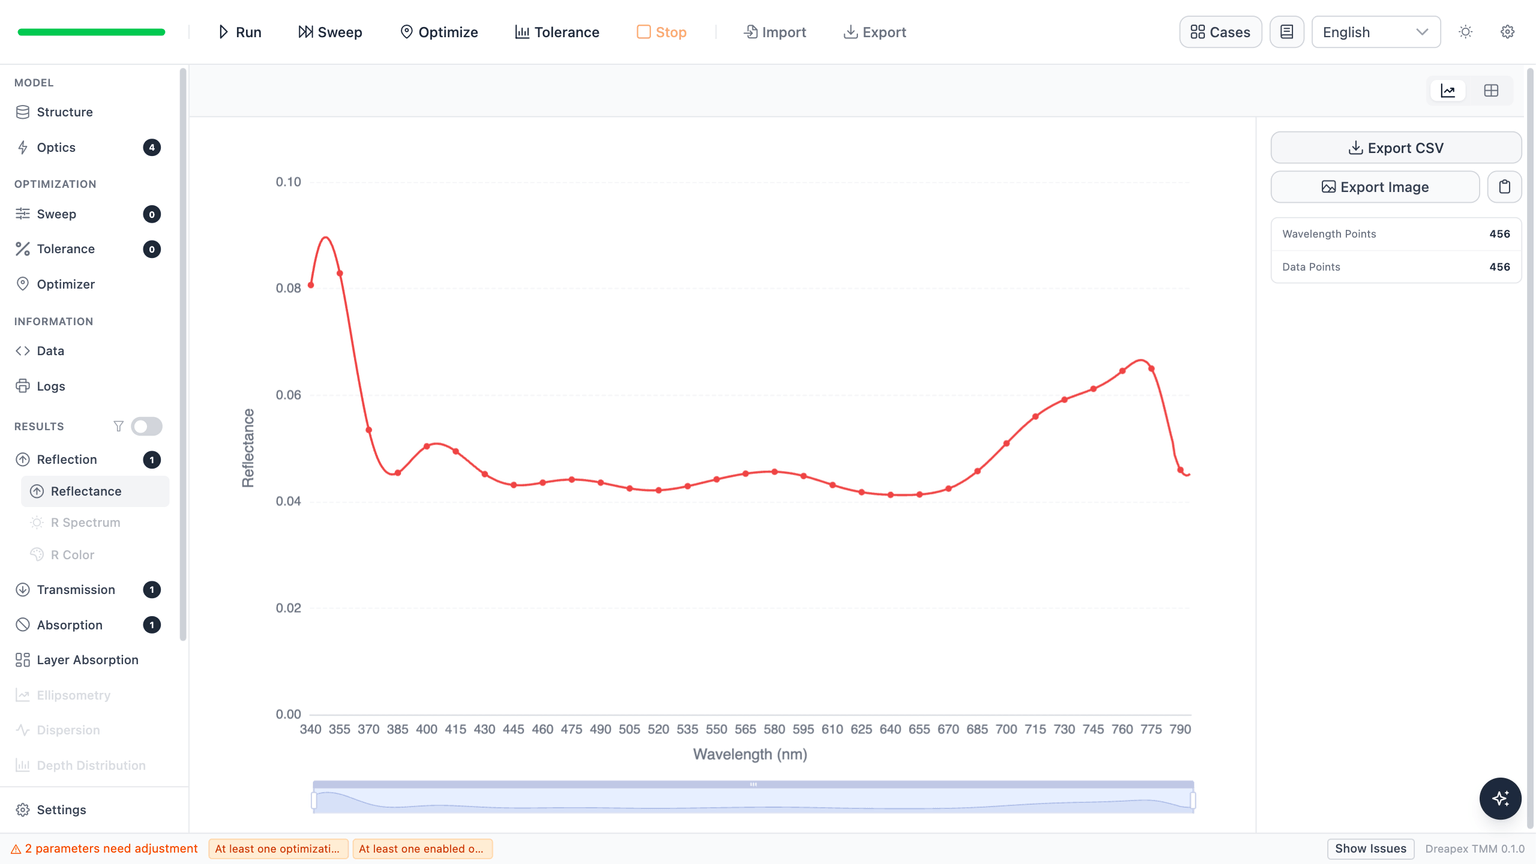
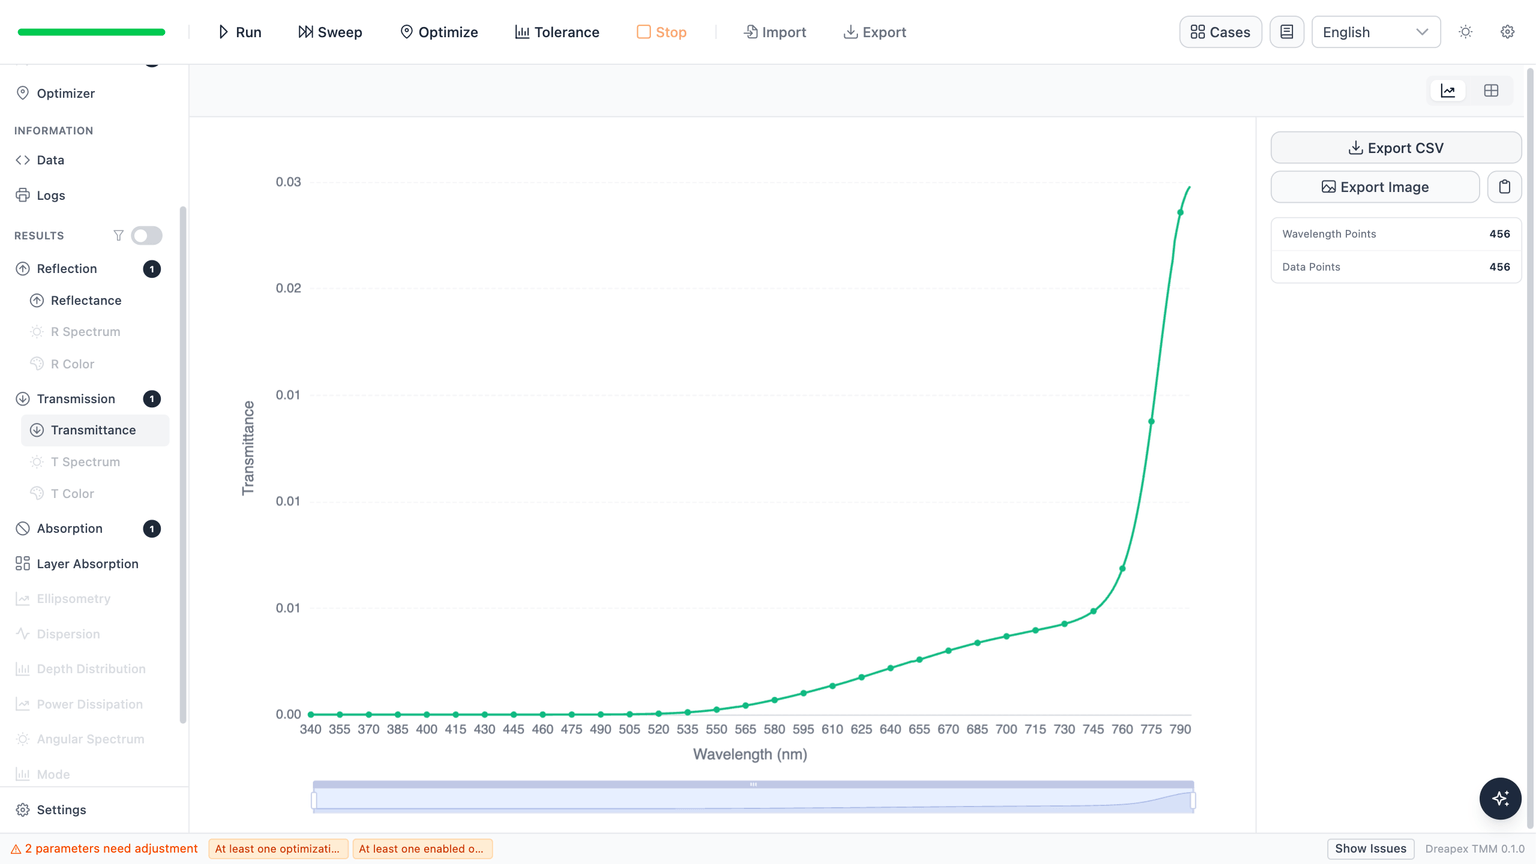
Across the 456 wavelength points from 340 to 795 nm, Dreapex TMM's R, T, and LHE overlap the authors' supplementary calculation point by point. The maximum absolute LHE difference is approximately .
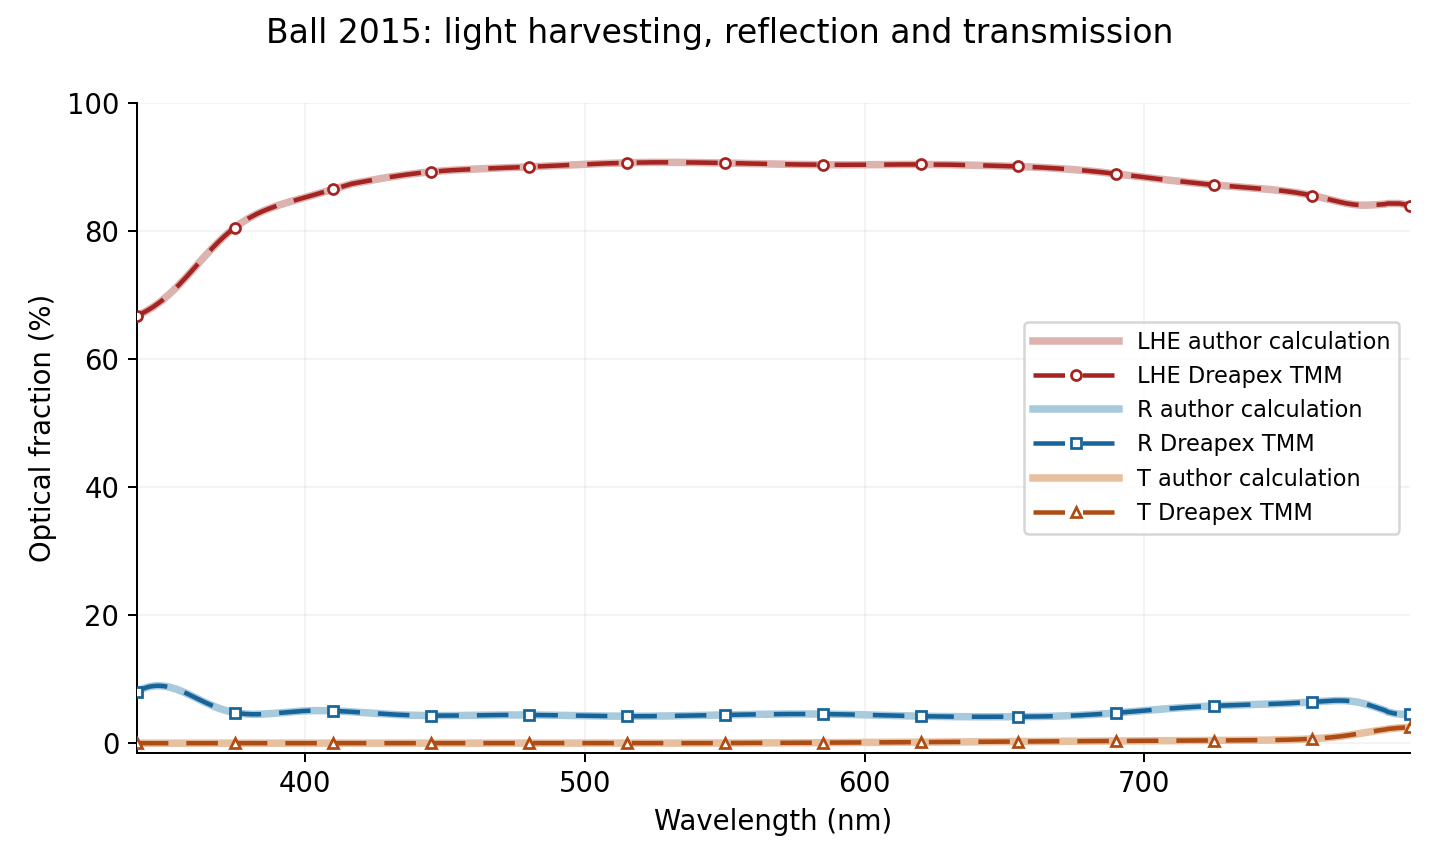
Dreapex TMM simulation data: layer absorption, R, T, and LHE · Authors' supplementary calculation and Dreapex TMM comparison data
Equivalent Optical Current and Losses (Figure 4c)
The currents below are obtained by integrating the simulated spectra above with the solar photon flux. Active-region absorption gives ideal photocurrent; reflection, transmission, and non-active-layer absorption give equivalent optical loss currents. All spectra retain their fractions of incident power and use the same solar weighting:
is current density in mA/cm², with subscript identifying the selected optical quantity. is a dimensionless optical fraction: LHE, R+T, or a selected layer's absorption. is wavelength in nm and is wavelength in m, with subscript m indicating metres.
is solar spectral power density in W/m²/nm, obtained by multiplying the original file values by 10. The factor 0.1 converts A/m² to mA/cm².
The elementary charge , Planck constant , and vacuum speed of light retain the supplementary values of C, J·s, and m/s, respectively. Integrate over 340–795 nm using the supplement's Simpson method.
| Quantity, 340–795 nm | Paper p. 606, mA/cm² | Dreapex TMM, mA/cm² |
|---|---|---|
| Reflection and transmission loss R+T | 1.36 | 1.358 |
| FTO absorption loss | 1.38 | 1.382 |
| Total parasitic absorption loss | 1.72 | 1.720 |
Total parasitic absorption includes all finite layers except TPema and Perov, so it already includes FTO. Rounding the three calculated values to the paper's decimal places reproduces the reported values. FTO accounts for approximately 80% of the equivalent parasitic absorption current.
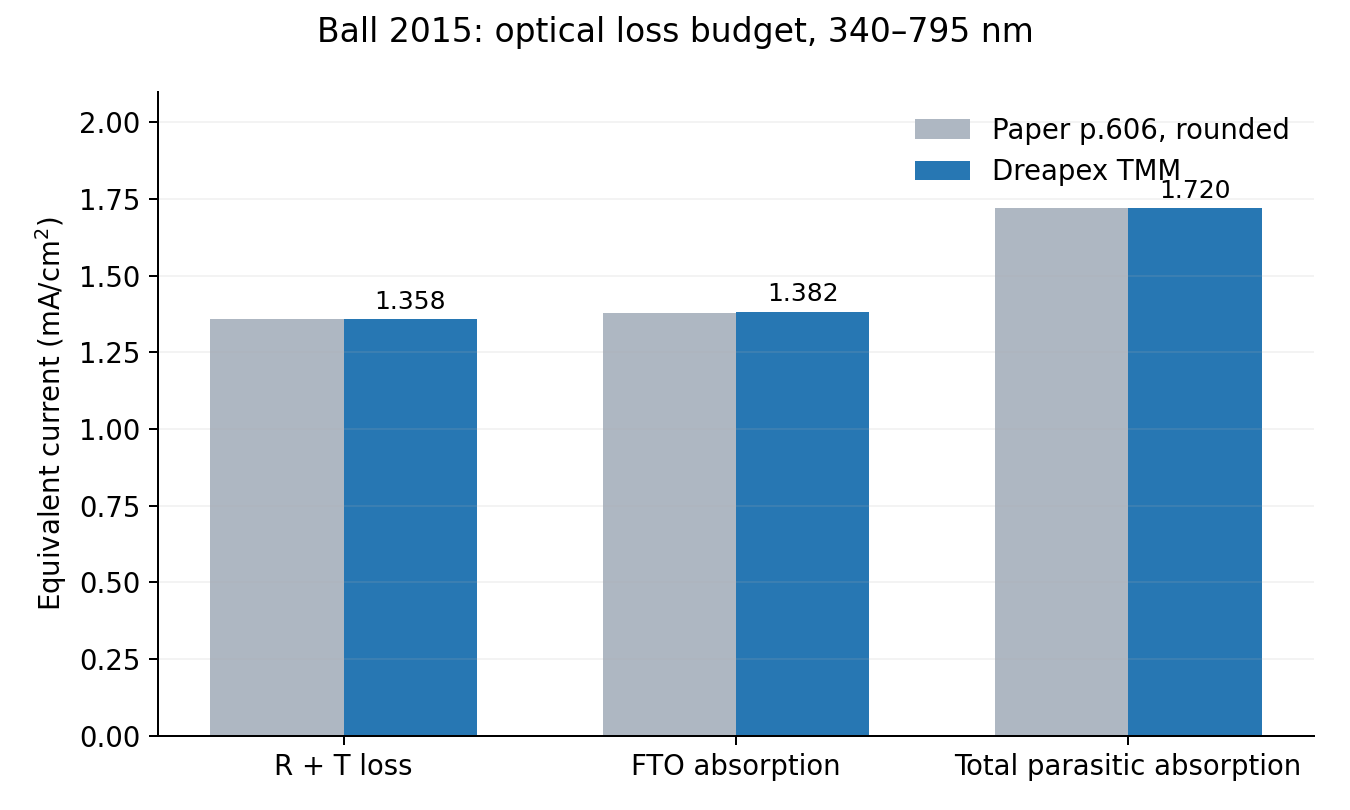
Paper text and Dreapex TMM simulation comparison data: three loss currents
TPema and Perov contribute 4.123 and 19.462 mA/cm², respectively, totaling 23.584 mA/cm², consistent with the authors' supplementary calculation. The approximately 23.8 mA/cm² in the paper additionally includes an estimated contribution below 340 nm and therefore uses a different spectral range.
Deviation Notes
- The structure and all n and k data use the original default supplementary inputs without material substitution. The supplement sets SodaLime to 2000 nm; this value and its incoherent treatment are retained.
- Spectra and loss integrals here cover 340–795 nm. The paper's approximately 23.8 mA/cm² includes a short-wavelength correction, whereas the present finite-band integral is 23.584 mA/cm².
- The thickness in Figure 4b includes the effective-medium layer, and its internal quantum efficiency calculation requires a measurement file absent from the ZIP. That thickness sweep is therefore not reproduced here.
Back to Case Studies · Next: Hole Transport Layers and Thickness Effects in Perovskite Solar Cells