Host Control of Dipole Orientation in TADF Emitters
What Controls the Orientation of TADF Emitters?
Authors: Bilal A. Naqvi, Markus Schmid, Ettore Crovini, Prakhar Sahay, Tobias Naujoks, Francesco Rodella, Zhen Zhang, Peter Strohriegl, Stefan Bräse, Eli Zysman-Colman, Wolfgang Brütting
Journal: Frontiers in Chemistry 8, 750 (2020) · Comparison target: Figure S2 and Figure S3
Take one TADF emitter and swap the co-evaporated host from mCBP-CN to mCP: the main lobe of the p-polarized angle-resolved photoluminescence rises from 0.90 to 1.48, and the recovered vertical dipole fraction climbs from 0.21 to 0.52.
This case builds one 22 nm doped film, changes the host index and the orientation value 14 times to reproduce the curves of supplementary Figures S2 and S3, and then works backwards to recover the orientation from each curve.
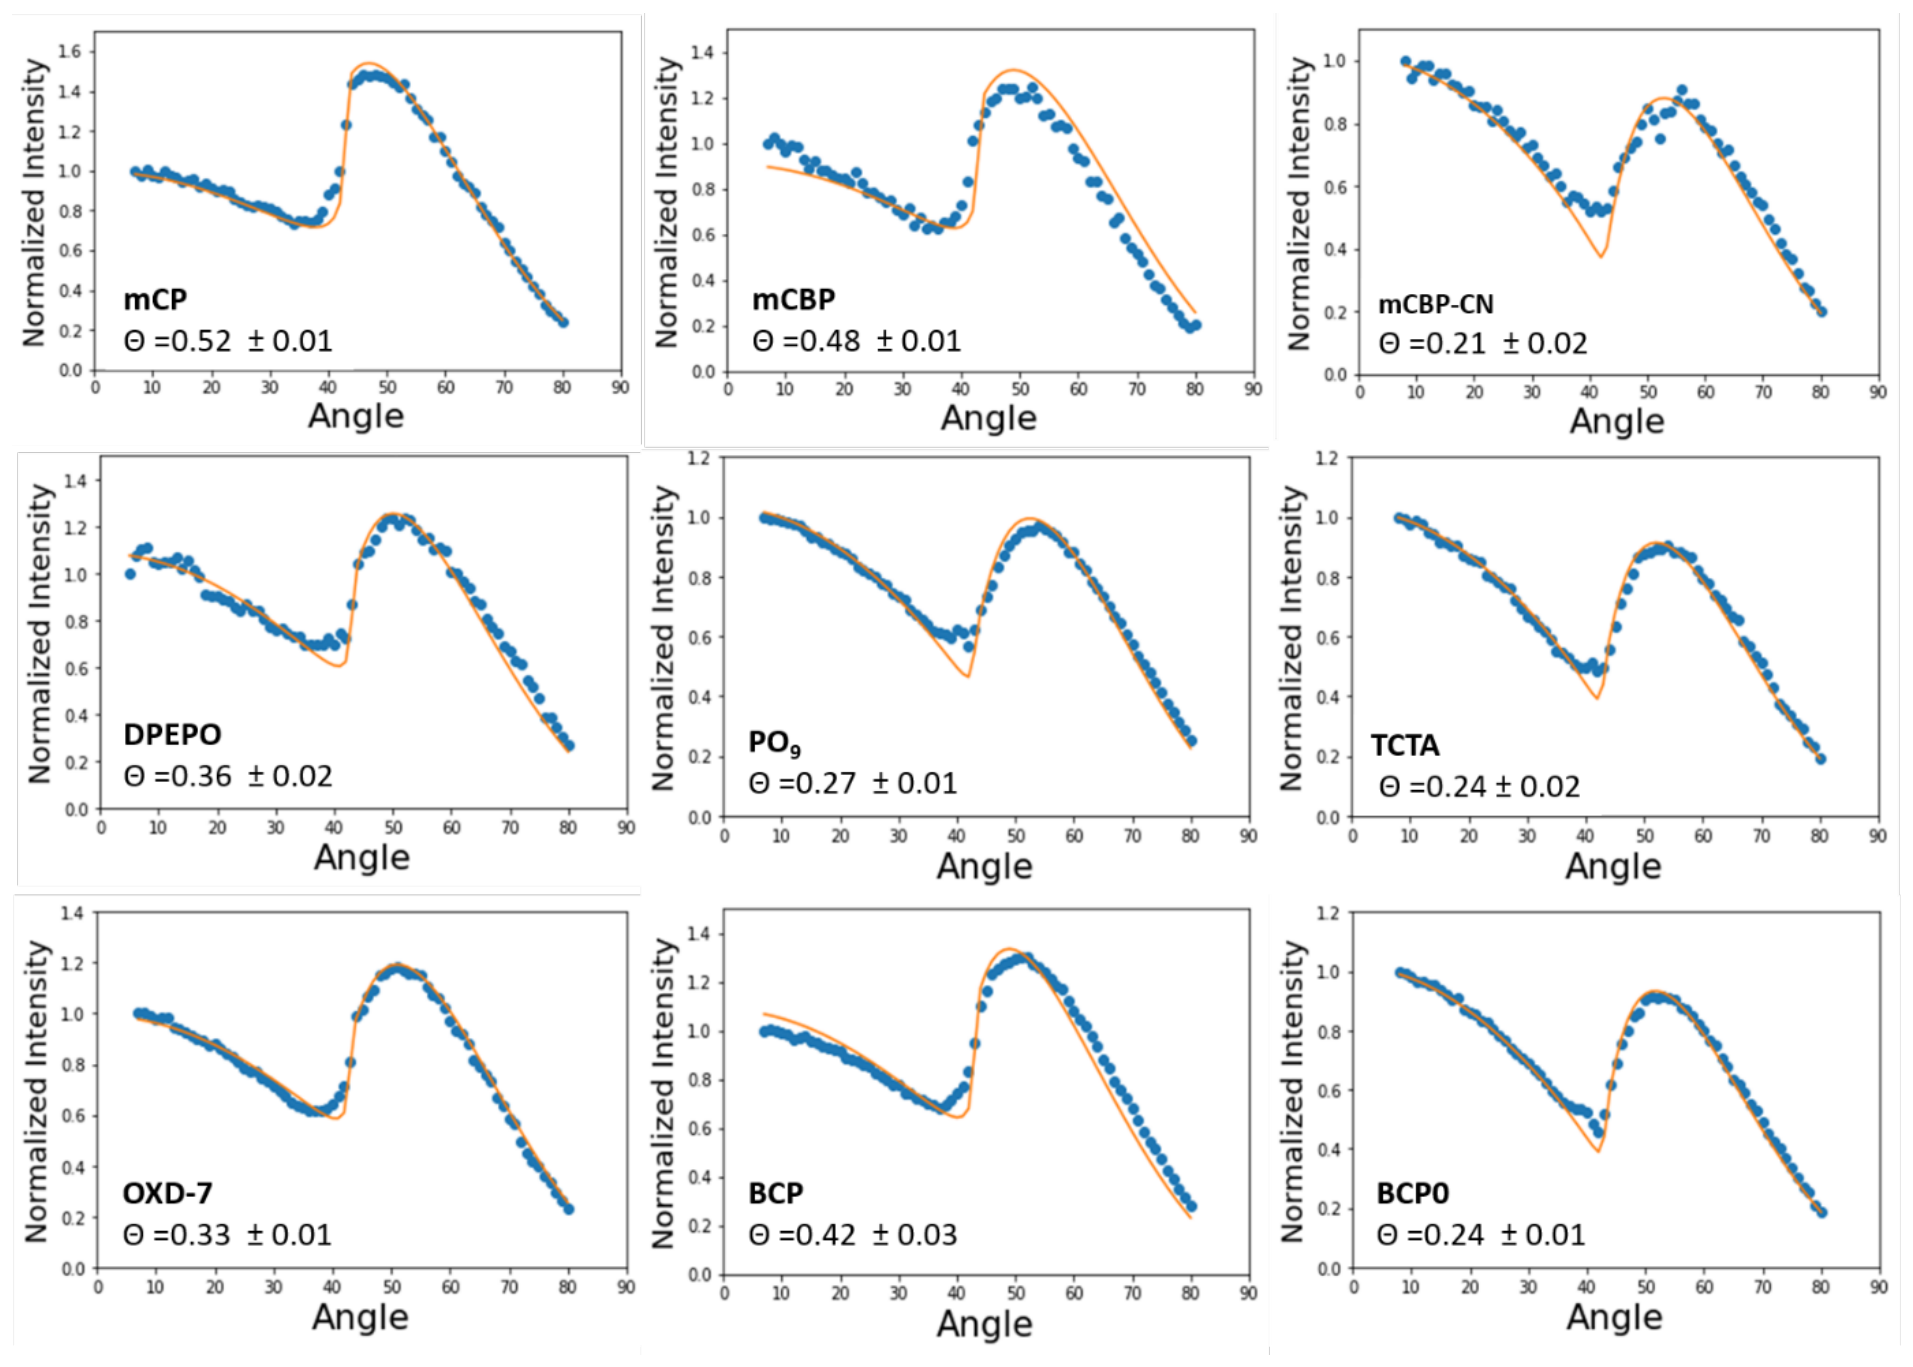
The nine panels share one horizontal axis. Every curve drops into a sharp minimum near 43° and then forms a main lobe between 46° and 56°. The closer the orientation is to horizontal, the lower the lobe and the further right its peak.
Background
Angle-resolved photoluminescence bonds the doped film and its substrate to a fused-silica prism with index-matching fluid and collects light angle by angle from the prism side. The matching fluid removes the back-surface interface, so the stage reading equals the emission angle inside the silica. The s-polarized curve is insensitive to orientation; the shape of the p-polarized curve is the channel that carries it.
Orientation is the vertical dipole fraction : 0 means all dipoles lie parallel to the film, 1 means all perpendicular, and 1/3 is isotropic. Smaller is better, because radiation from vertical dipoles is more easily trapped into waveguide modes or surface plasmons.
The sharp kink near 43° is total internal reflection at the film–air interface: fused silica at has a critical angle of 43.1°, beyond which the air side becomes evanescent. All 14 panels kink at the same angle.
The paper builds an orientation series from two emitters: DMAC-TRZ can rotate, and its nine hosts span from 0.21 to 0.52; ICzTRZ is rigid and planar, and its five hosts all land between 0.06 and 0.12.
Structure
The index-matching fluid merges substrate, fluid, and prism into one body, so the detection side is treated as semi-infinite fused silica with no separate substrate layer.
| Position | Material | Thickness | Optical input |
|---|---|---|---|
Incidence Medium (detection side) | Fused-silica prism and substrate | Semi-infinite | , |
| Doped film | 10 wt% emitter co-evaporated in host | 22 nm | Per host, below |
Transmission Medium | Air | Semi-infinite | , |
The doped film takes the measured index of the neat host and is treated as non-absorbing, matching the paper's own analysis convention.
| Host | at 500 nm | Source |
|---|---|---|
| mCP | 1.7566 | Measured material data |
| mCBP | 1.7622 | Measured material data |
| mCBP-CN | 1.7468 | Measured material data |
| DPEPO | 1.6730 | Measured material data |
| BCP | 1.7327 | Measured material data |
| TCTA | 1.8356 (other principal axis 1.7142) | Measured material data, birefringent |
| OXD-7 | 1.6270 | Digitized from a supplementary curve |
| PO9 | 1.7240 | Digitized from a supplementary curve |
| BCPO | 1.6970 | Digitized from a supplementary curve |
The last three have no measured dataset, with a digitization accuracy of about ±0.01. The effect on the result is small: 0.01 in moves by 0.004.
The structure table holds a single finite-thickness film, bounded by fused silica and air:

22 nm (shared across all 14 and fixed by a joint fit), 500 nm, and a uniform in-film distribution. All three are weak determinants: thickness anywhere from 18 to 26 nm moves the mean absolute deviation by only 0.002, and ±20 nm of wavelength moves it by less than 0.001. This system has no metal layer and a weak cavity effect, so thickness and wavelength enter only through phase and are nearly degenerate — which is why angle-resolved photoluminescence still yields reproducible orientation values without a reported film thickness.Optical and Emitter Settings
The 14 models change only two values: the doped-film and the emitter's orientation value. The four below span the ends and the middle of the DMAC-TRZ range:
| Model | Doped film | Doped-film | Orientation value (published ) |
|---|---|---|---|
| mCP | 10 wt% DMAC-TRZ in mCP | 1.7566 | 0.52 |
| BCP | 10 wt% DMAC-TRZ in BCP | 1.7327 | 0.42 |
| DPEPO | 10 wt% DMAC-TRZ in DPEPO | 1.6730 | 0.36 |
| mCBP-CN | 10 wt% DMAC-TRZ in mCBP-CN | 1.7468 | 0.21 |
Everything else is shared:
| Setting | Value |
|---|---|
| Spectrum type | Unit White |
| Dipole orientation | Custom; the orientation value is the vertical dipole fraction, the same convention as the paper |
| Dipole position | Relative position 0.5 |
| Dipole distribution | Gauss, width 100000 nm, 21 sample points (equivalent to uniform across the film) |
| Quantum efficiency | 1 |
| Detector | Intensity |
| Wavelength mode | Single, 500 nm |
| Angle mode | Sweep, 0°–89°, step 0.5° |
| Comparison quantity | The TM curve of Normalized Angular Distribution |
Excitation is a 325 nm ultraviolet laser at normal incidence absorbed throughout the film, so the dipoles are distributed uniformly. The emitter panel:

The angle sweep is defined inside the Incidence Medium, the same quantity as the paper's stage reading:

The normalized angular distribution is evaluated at a fixed wavelength, so spectral amplitude and quantum efficiency cancel in the normalization and no measured photoluminescence spectrum is needed.
0 and 1 once each and combine them linearly by fraction instead of rerunning every value. All 14 comparisons here were produced from those two baseline curves.Simulation Results and Comparison with Figures S2 and S3
The two supplementary figures. DMAC-TRZ in nine hosts:
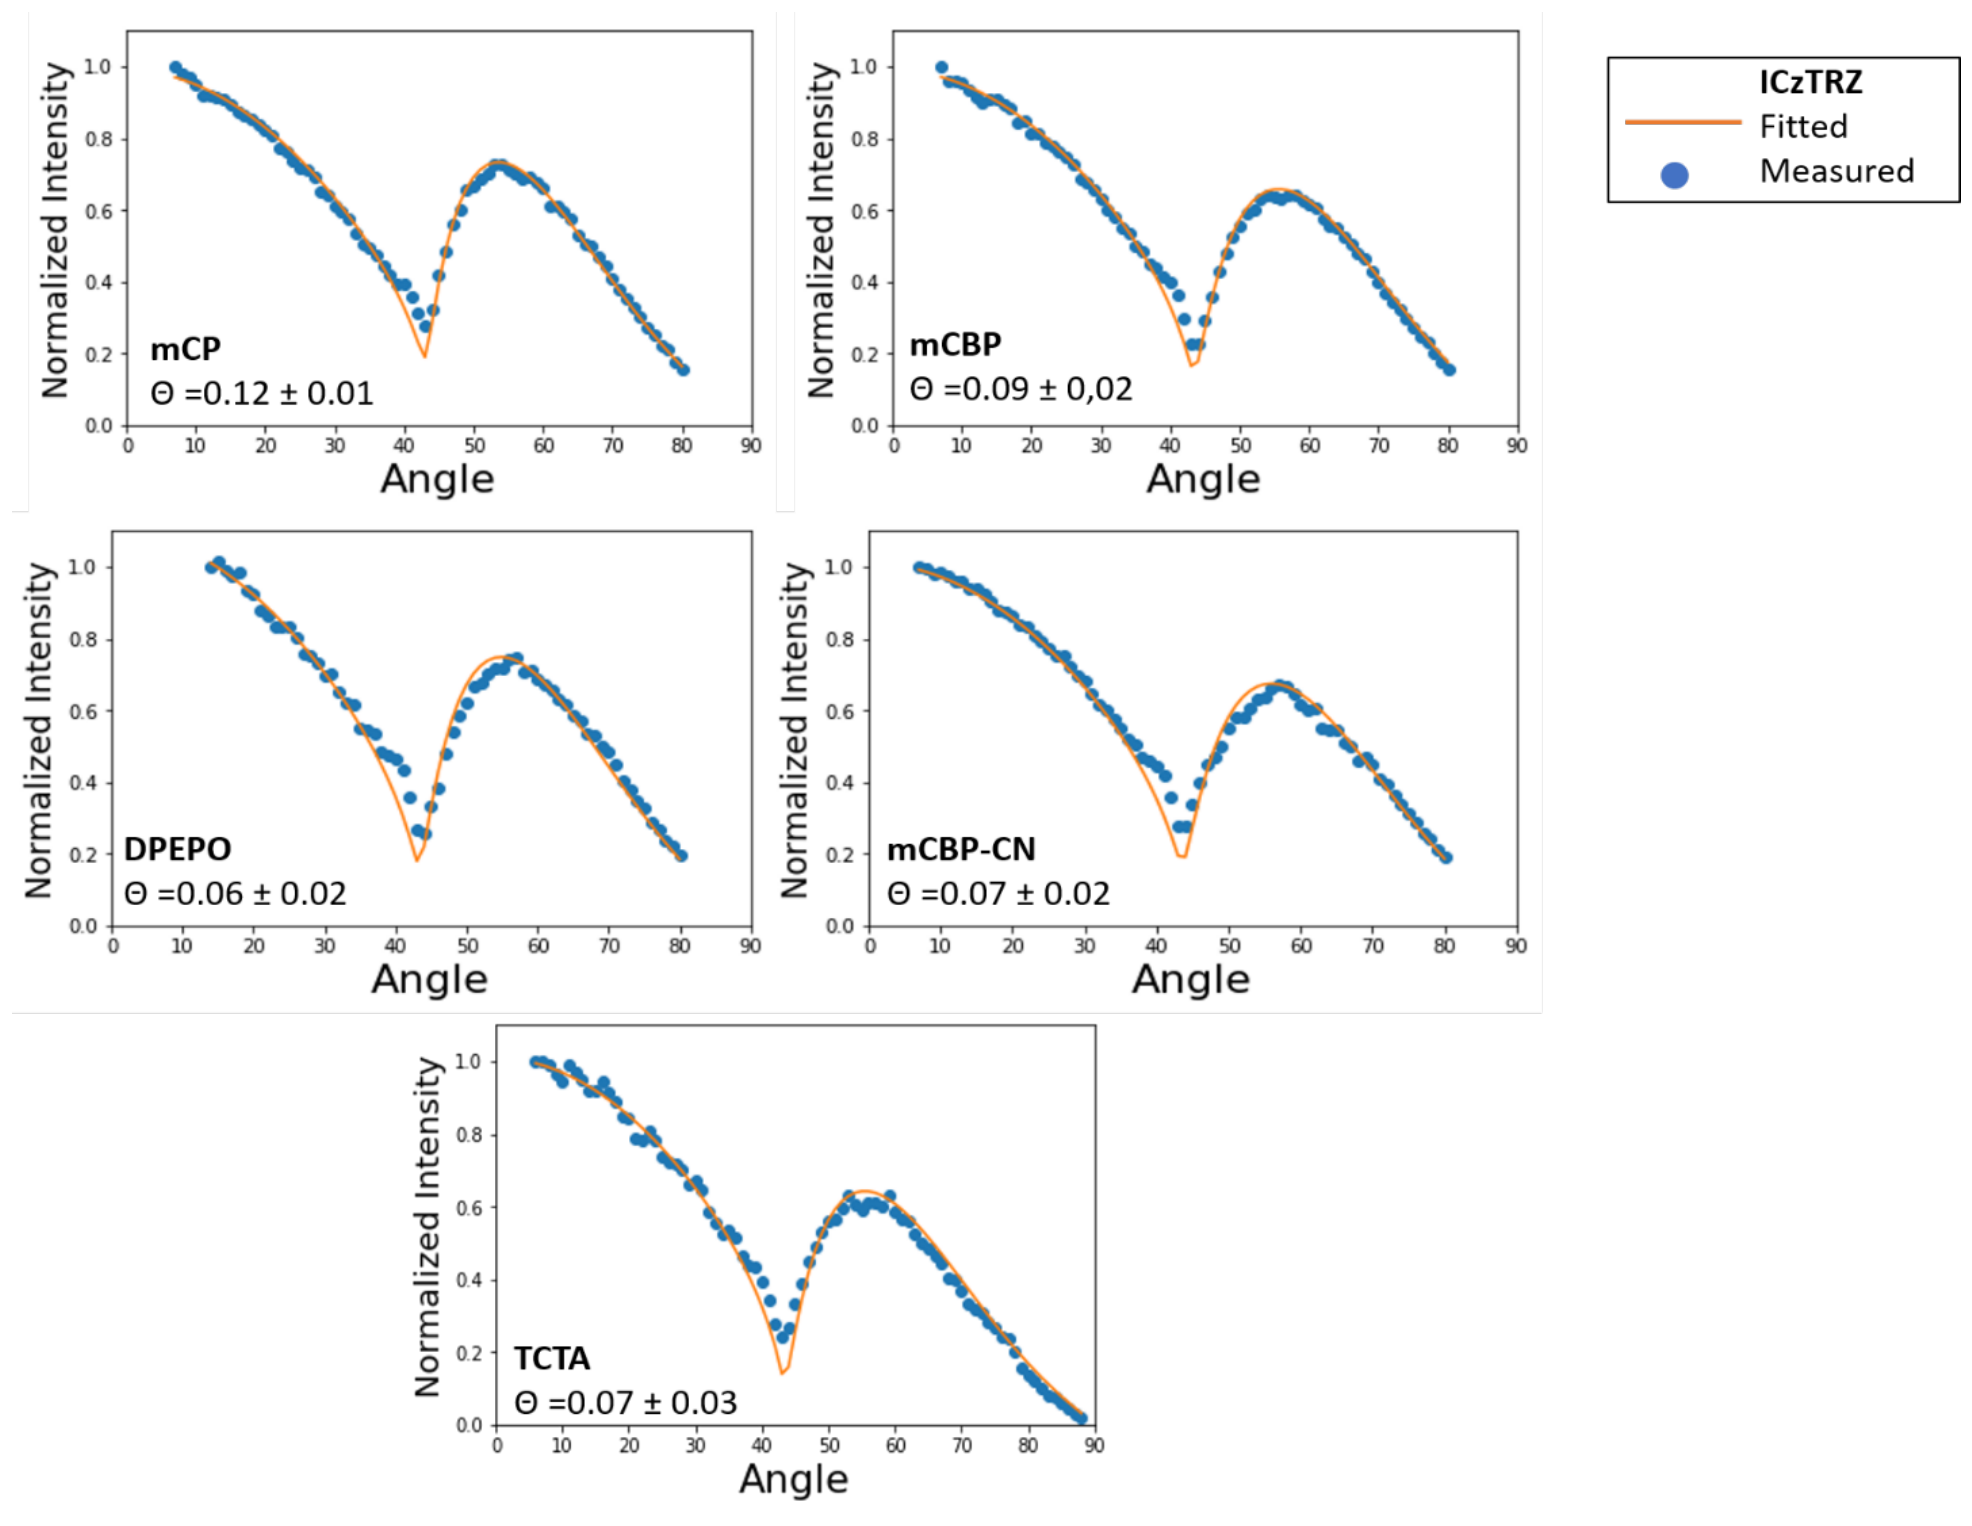
ICzTRZ in five hosts, all between 0.06 and 0.12 with closely similar lineshapes:
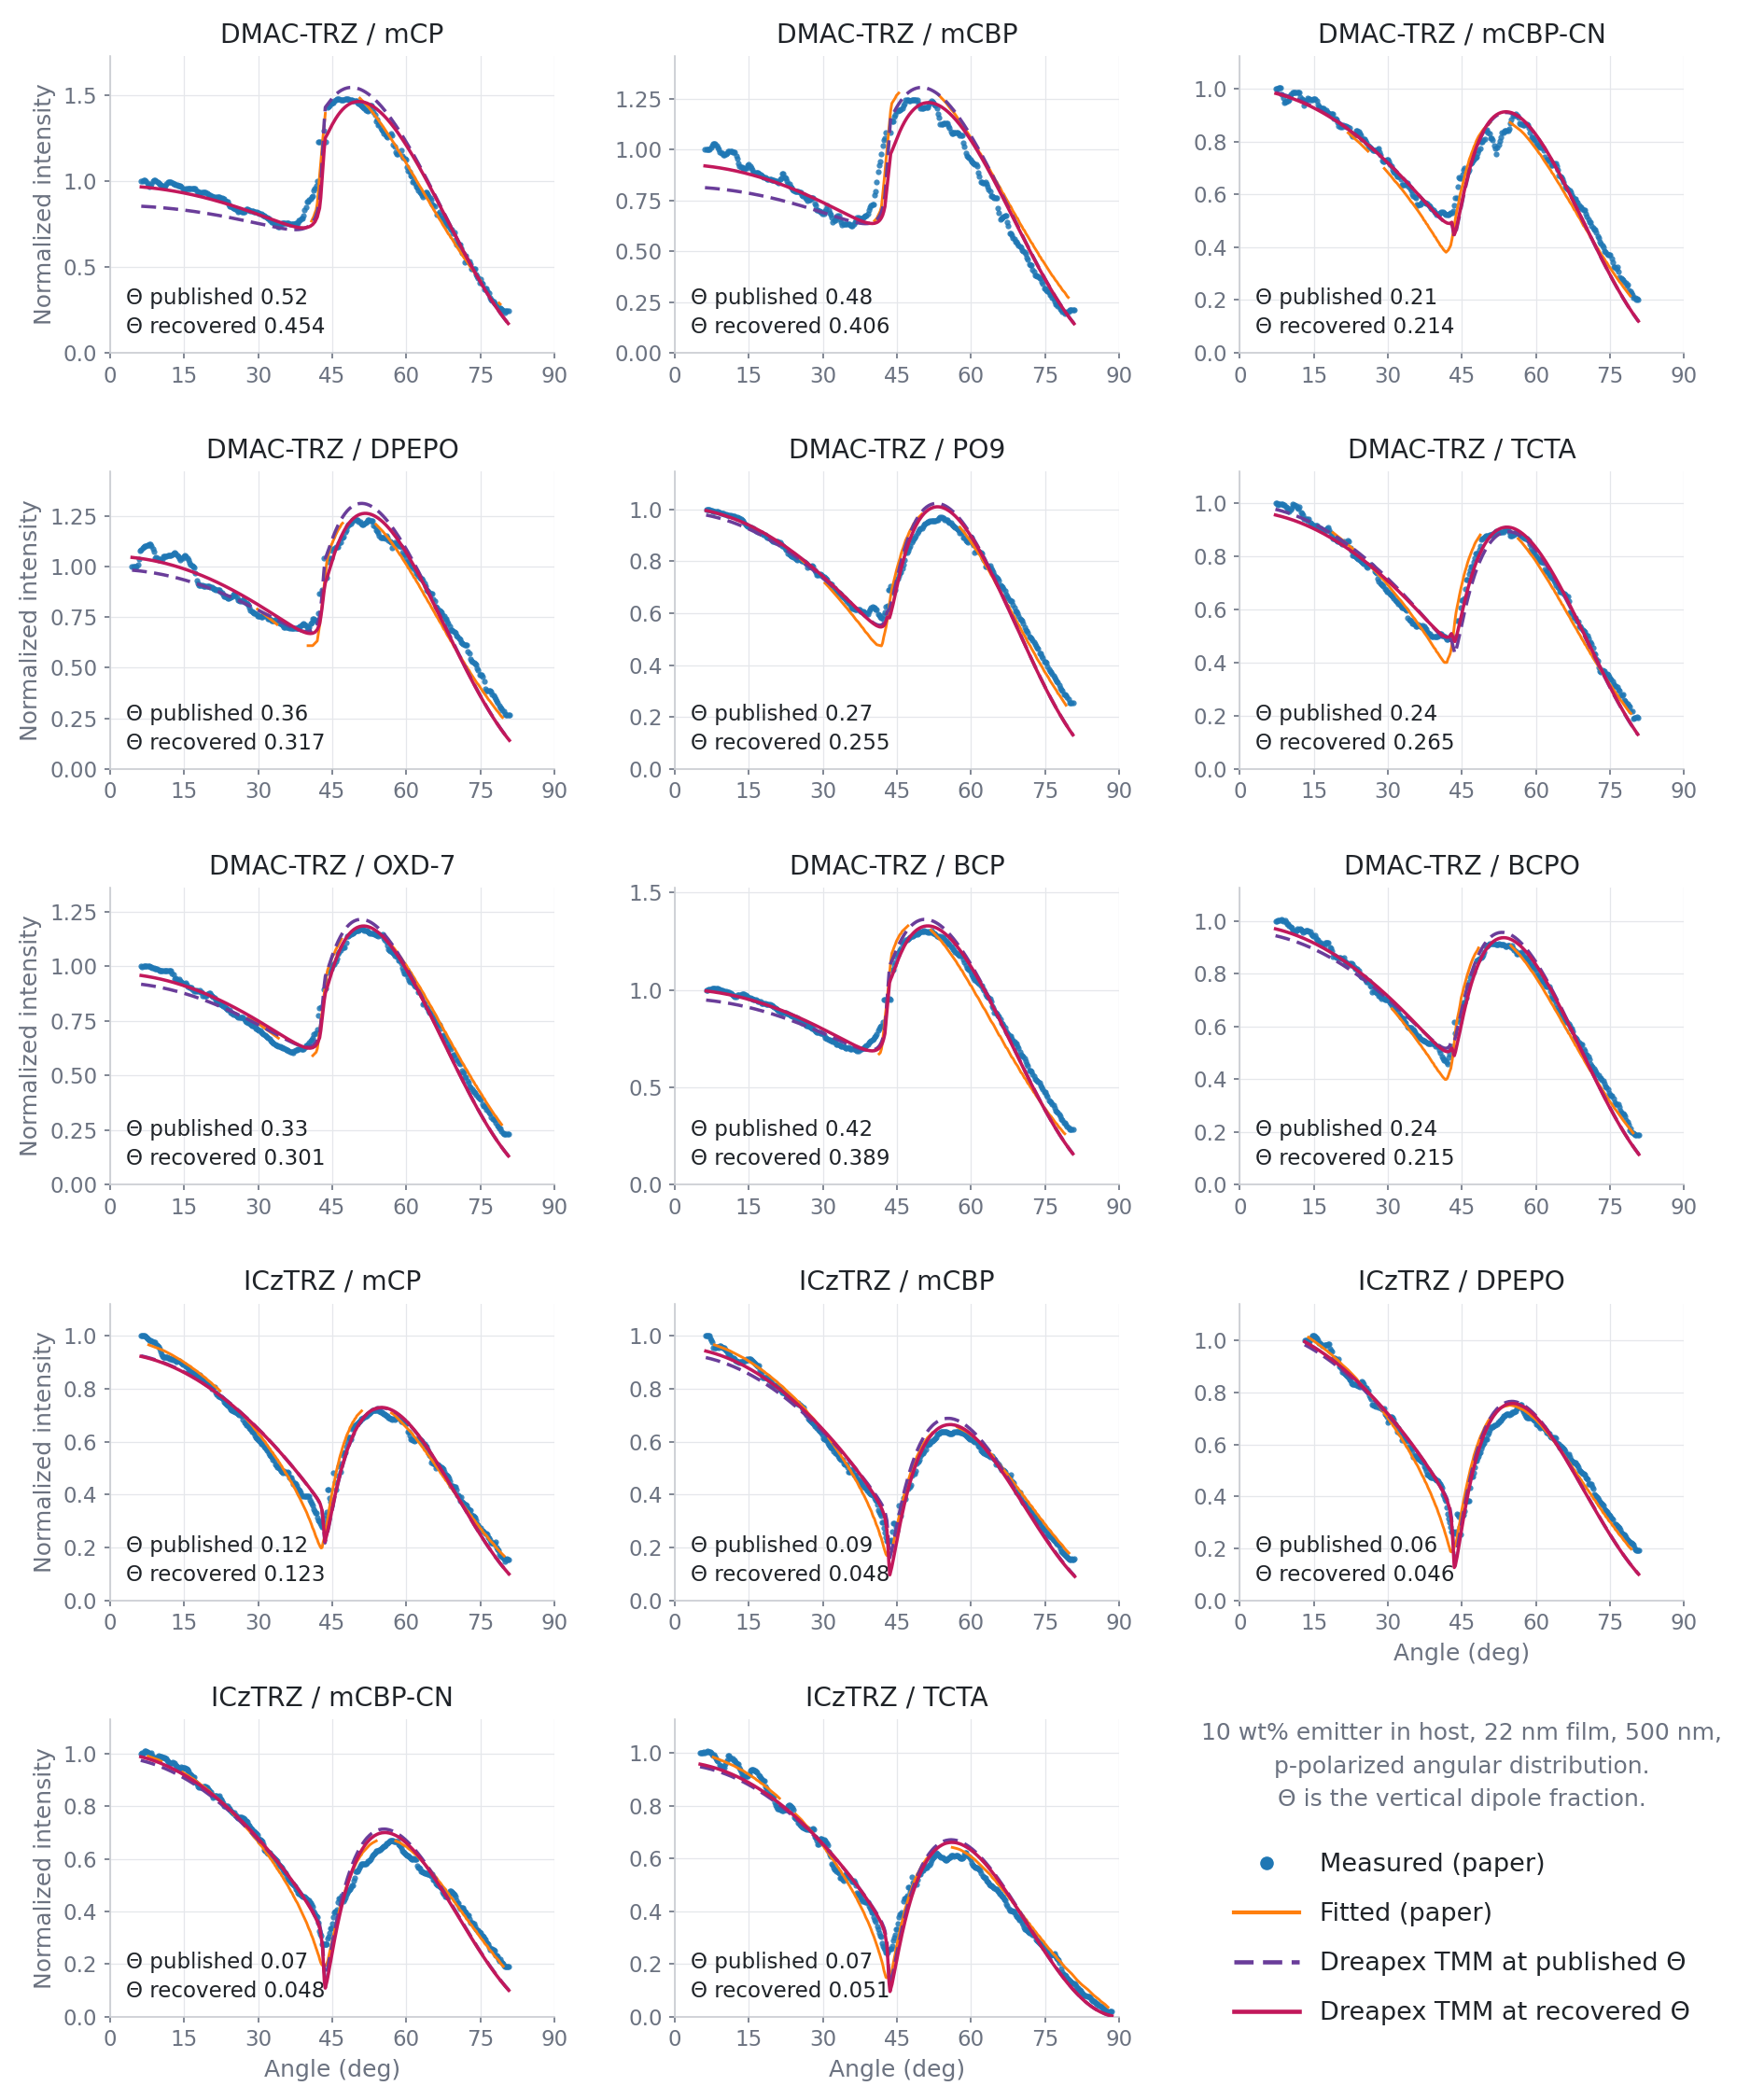
All 14 panels overlaid point by point:
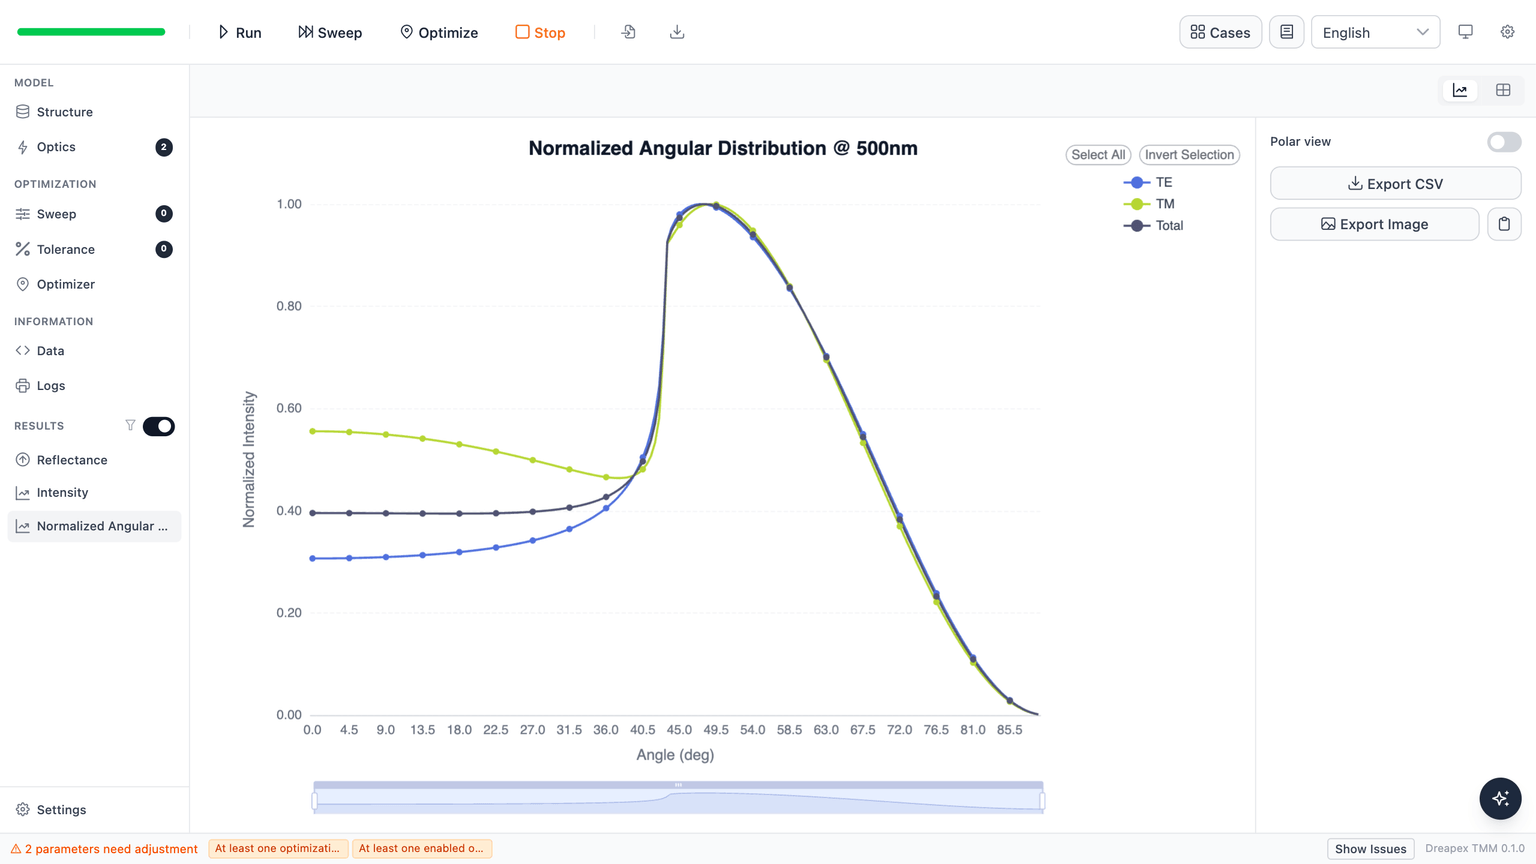
The four raw results from the app. The highest orientation, mCP, has a main lobe clearly above the near-normal value:
The lowest, mCBP-CN, has a main lobe that falls below the near-normal value:
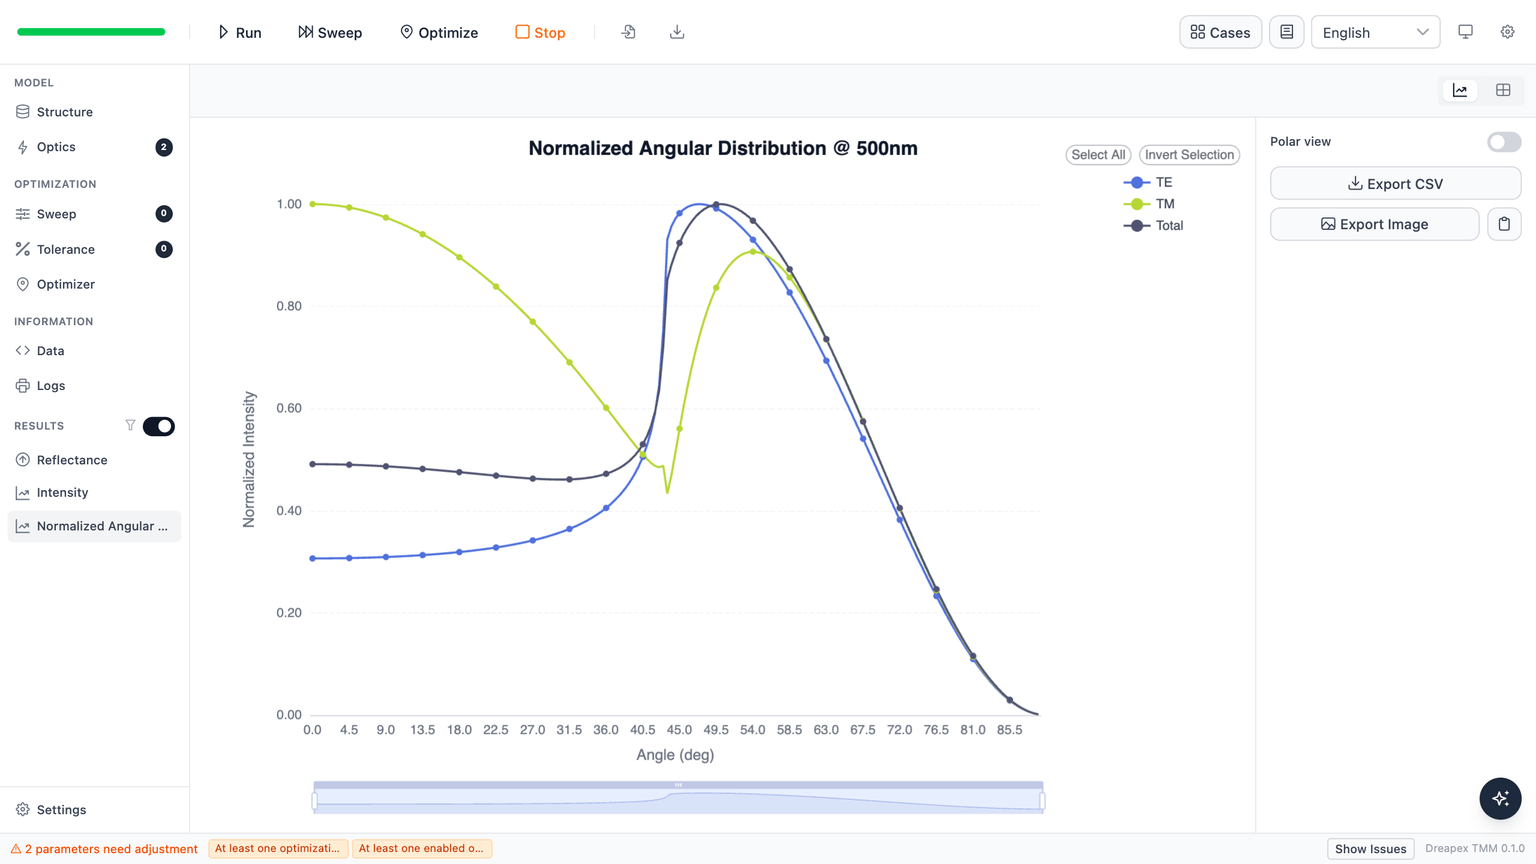
DPEPO in the middle, at 0.36:
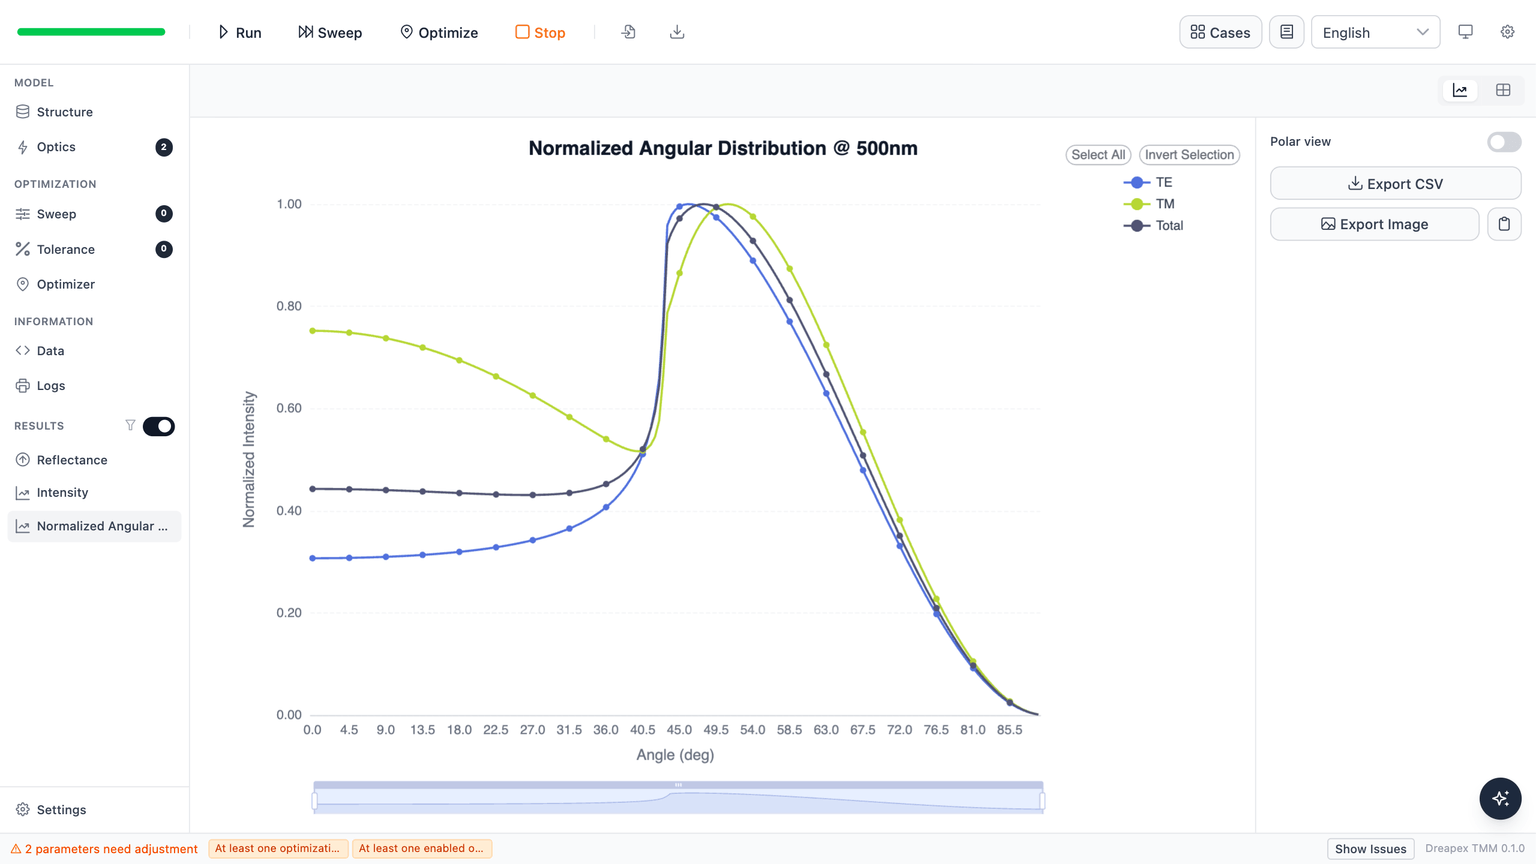
BCP at 0.42:
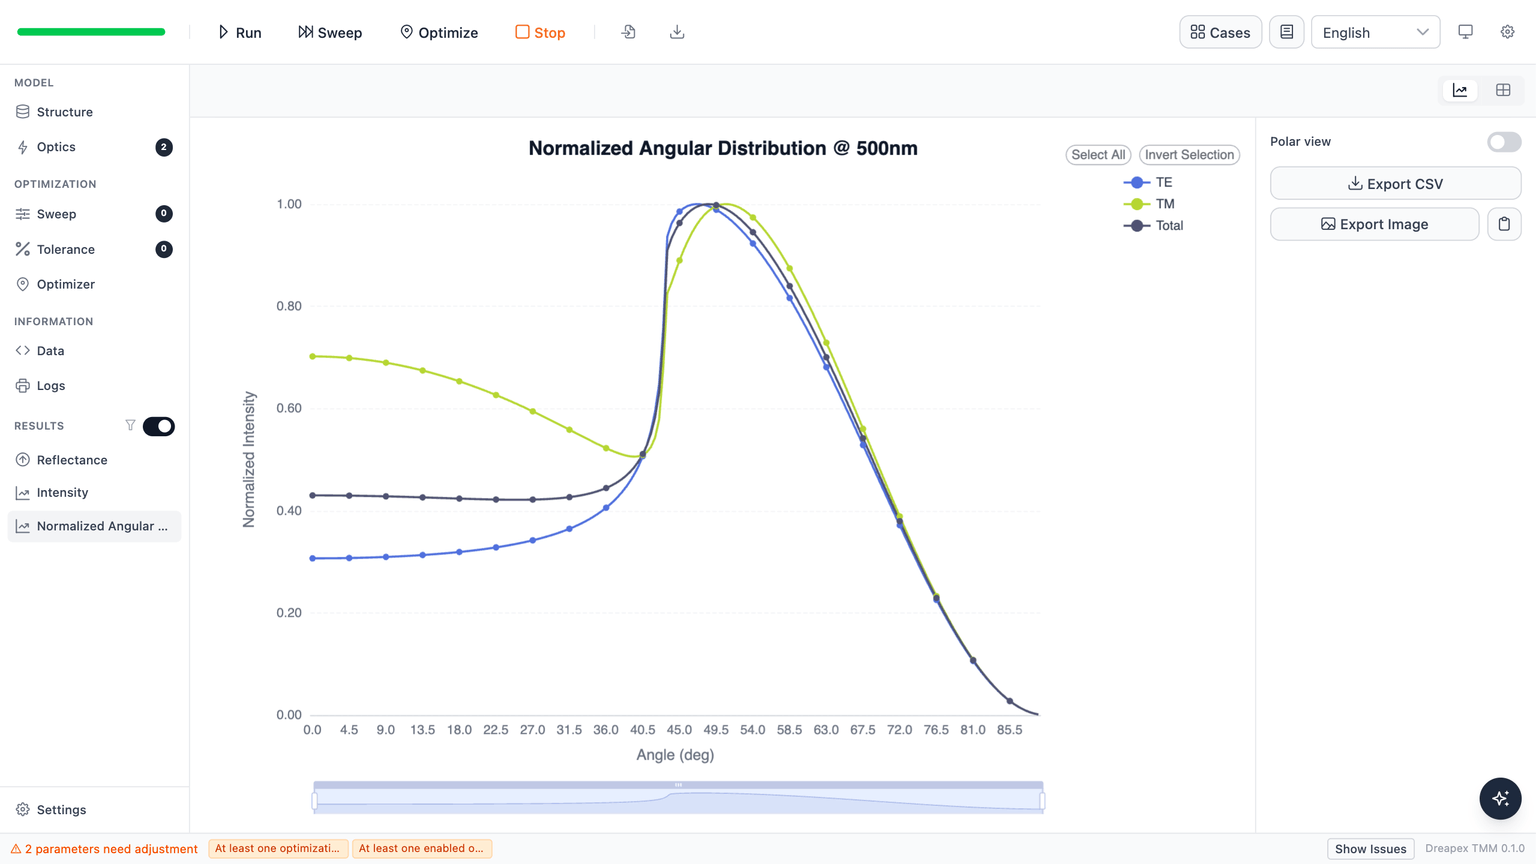
All four TM curves dip near 43°, and the main lobe rises and moves to smaller angles as the orientation value increases, matching the trend across the paper's panels.
Orientation recovered per film
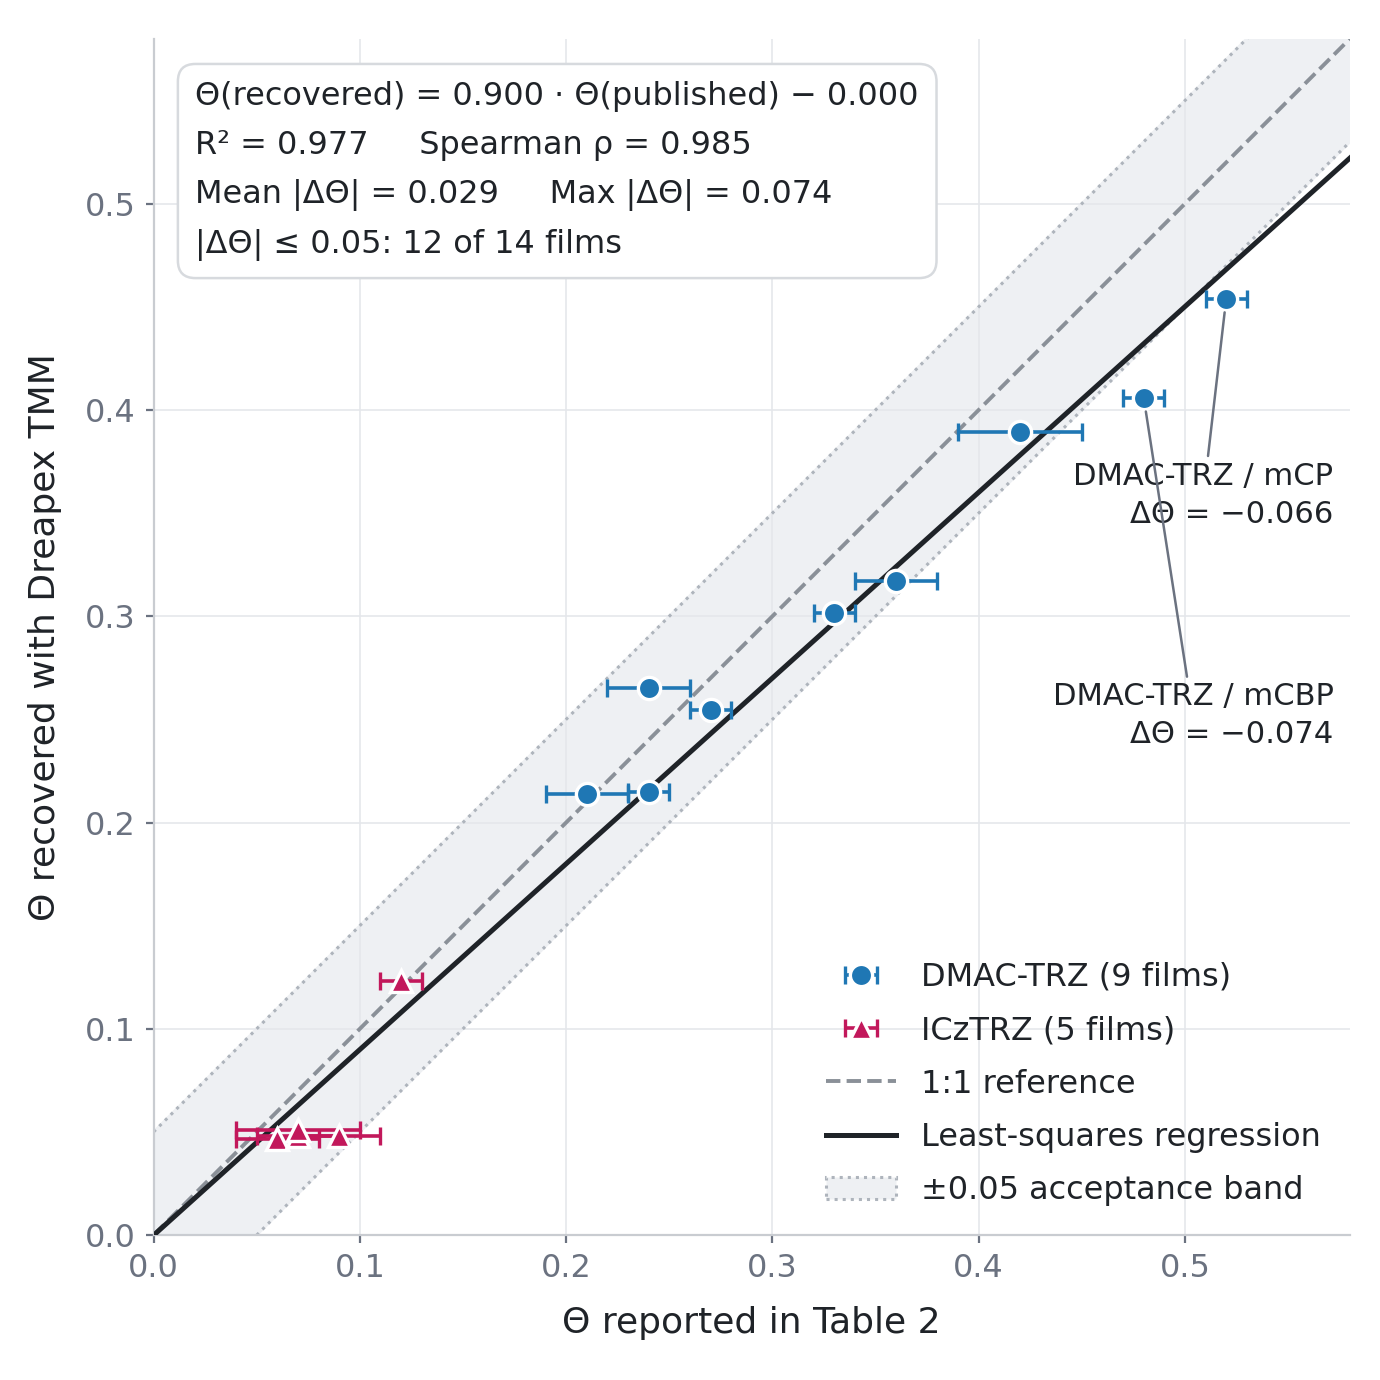
A linear least-squares fit to the measured points of each panel recovers that film's vertical dipole fraction, with 22 nm and 500 nm shared across all 14.
| Emitter / host | Doped-film | (paper) | (recovered) | |
|---|---|---|---|---|
| DMAC-TRZ / mCP | 1.7566 | 0.52 ± 0.01 | 0.454 | −0.066 |
| DMAC-TRZ / mCBP | 1.7622 | 0.48 ± 0.01 | 0.406 | −0.074 |
| DMAC-TRZ / mCBP-CN | 1.7468 | 0.21 ± 0.02 | 0.214 | +0.004 |
| DMAC-TRZ / DPEPO | 1.6730 | 0.36 ± 0.02 | 0.317 | −0.043 |
| DMAC-TRZ / PO9 | 1.7240 | 0.27 ± 0.01 | 0.255 | −0.015 |
| DMAC-TRZ / TCTA | 1.8356 | 0.24 ± 0.02 | 0.265 | +0.025 |
| DMAC-TRZ / OXD-7 | 1.6270 | 0.33 ± 0.01 | 0.301 | −0.029 |
| DMAC-TRZ / BCP | 1.7327 | 0.42 ± 0.03 | 0.389 | −0.031 |
| DMAC-TRZ / BCPO | 1.6970 | 0.24 ± 0.01 | 0.215 | −0.025 |
| ICzTRZ / mCP | 1.7566 | 0.12 ± 0.01 | 0.123 | +0.003 |
| ICzTRZ / mCBP | 1.7622 | 0.09 ± 0.02 | 0.048 | −0.042 |
| ICzTRZ / DPEPO | 1.6730 | 0.06 ± 0.02 | 0.046 | −0.014 |
| ICzTRZ / mCBP-CN | 1.7468 | 0.07 ± 0.02 | 0.048 | −0.022 |
| ICzTRZ / TCTA | 1.8356 | 0.07 ± 0.03 | 0.051 | −0.019 |
Ensemble statistics and ordering
All 14 films on a parity plot:
| Statistic | All 14 | The 9 DMAC-TRZ films | The 5 ICzTRZ films |
|---|---|---|---|
| Mean absolute deviation | 0.029 | 0.035 | 0.020 |
| Largest absolute deviation | 0.074 | 0.074 | 0.042 |
| Mean deviation | −0.025 | −0.028 | −0.019 |
| Regression slope | 0.900 | 0.757 | 1.256 |
| Spearman rank correlation | 0.985 | 0.971 | 0.821 |
The full ordering from 0.06 to 0.52 is reproduced, with a rank correlation of 0.985 and no pair of hosts ordered the wrong way. The regression slope of 0.900 with shows the deviation is a scale compression, not random scatter. The 43.1° critical-angle kink coincides with the measured kink in all 14 panels.
The all-angle RMS across the 14 curves averages 6.41 %. For reference, comparing the paper's own published fits against its own measured points gives an average RMS of 5.90 %, the digitization noise floor of these supplementary figures.
Deviation Notes
The mean deviation of −0.025 shares a sign across all 14 films and comes mostly from the small-angle branch below 25°. Restricting the fit to angles above 25° zeroes the mean deviation, but that amounts to picking an angular window, so this case does not do it — and over the same angular range the paper's own fitted lines also depart from its own measured points.
The doped film uses the measured index of the neat host and is treated as non-absorbing, ignoring the correction from 10 wt% doping — the paper lists this as an error source as well.
TCTA and PO9 are birefringent. With only one film in the structure, the two principal indices are used to bracket the result instead: at 1.8356 and 1.7142 for TCTA, the absolute deviation stays within 0.037 on either branch.
The reference values come from independent digitization of the supplementary figures, not from numerical source data.