Recovered Dipole Orientation of a Perovskite Nanocrystal Superlattice Film
Anisotropic nanocrystal superlattices overcoming intrinsic light outcoupling efficiency limit in perovskite quantum dot light-emitting diodes
Authors: Sudhir Kumar, Tommaso Marcato, Frank Krumeich, Yen-Ting Li, Yu-Cheng Chiu, et al. (corresponding author Chih-Jen Shih)
Journal: Nature Communications 13, 2106 (2022) · Comparison target: Figure 3a
Whether the dipoles in an emissive layer lie flat or stand up decides how much light the same device stack can extract. The standard way to measure it is to index-match the film to a hemispherical glass lens, record p-polarized photoluminescence angle by angle, and invert that curve for the orientation ratio with a thin-film optical model.
This case builds a two-layer weak-cavity model — 18 nm of hole-transport layer plus a 30 nm emissive layer between glass and air — runs one angle sweep to get the curve of paper Figure 3a, and then recovers the horizontal dipole ratio from the 18 measured points in that figure.
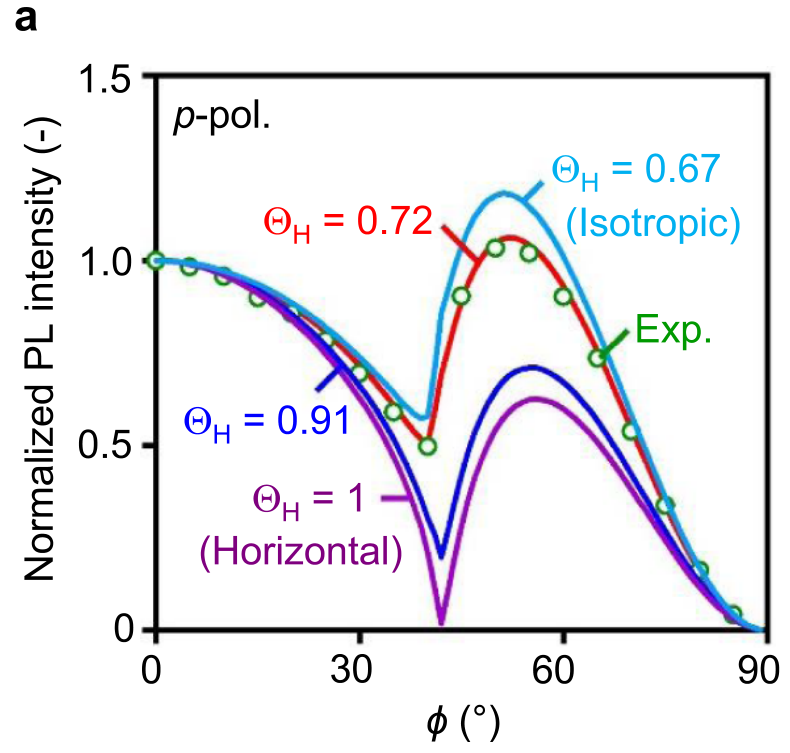
The measurements are normalized to 1 at 0°, fall monotonically to a minimum of 0.498 at 40°, jump past the glass–air critical angle to 1.034 at 50°, and then decay to 0.042 at 85°. The curve for a horizontal dipole ratio of 1 goes exactly to zero at 41.9°; the lower the ratio, the shallower the minimum near 41° and the larger the share above 41° in substrate modes.
Background
The hemispherical lens and the index-matching fluid remove the back-surface interface, so the stage reading equals the emission angle inside the glass and the substrate can be treated optically as a semi-infinite medium. That makes the substrate-mode region above 41° measurable, where a conventional measurement without a hemispherical lens traps that light by total internal reflection.
The shape of the p-polarized curve is sensitive to the spatial orientation of the transition dipole moment: dipoles parallel to the film concentrate energy at small angles, dipoles perpendicular to it send energy to large angles. The sharp feature near 41° is total internal reflection at the glass–air interface, with a critical angle of 41.14° for glass at . Beyond it the air side becomes evanescent, p-polarized emission from horizontal dipoles nearly vanishes, and vertical dipoles couple strongly into the substrate at the same angle. That is the mechanism the paper uses to resolve orientation.
Vertical Fraction field is the vertical fraction; the two sum to 1, so the published 0.72 is entered as 0.28. Before using any orientation value from the literature, check whether it reports the horizontal fraction, the vertical fraction, or the order parameter.Structure
The stack is just air, the emissive layer, and the hole-transport layer, plus glass treated as a semi-infinite medium. There is no metal mirror, so this is a weak-cavity system: the result is insensitive to absolute efficiency and emission depth and depends only on the two indices, the two thicknesses, and the orientation ratio.
| Position | Material | Thickness | Optical input |
|---|---|---|---|
Incidence Medium (detection side) | Glass | Semi-infinite | , |
| Layer 1 | X-F6-TAPC hole-transport layer | 18 nm | Wavelength-resolved , 1.5648 at 528 nm; |
| Layer 2 | Nanocrystal superlattice emissive layer | 30 nm | below; |
Transmission Medium | Air | Semi-infinite | , |
Incidence Medium is the key step of this case: angular distributions are defined inside the incidence medium, so with glass there the viewing angle reaches 90° and covers the whole substrate-mode region the paper measures with its hemispherical lens. Moving glass to the Transmission Medium gives the air-side distribution instead, with no data above 41° and no critical-angle feature.The emissive-layer extinction coefficient comes from the published 528 nm optical density of 0.011 over 30 nm, giving 0.0355. The refractive index has two published values, given in two different places:
Value at 528 nm | Where the paper gives it | Validity |
|---|---|---|
1.760 | at 530 nm in the main text and supplementary information, from ellipsometry | Stated directly, at a wavelength adjacent to the 528 nm used here |
1.680 | Supplementary dispersion parameters evaluated at 528 nm | That fit used only non-absorbing data over 550–850 nm, so 528 nm is an extrapolation |
This case takes 1.760 for its main result — the paper's own supplementary efficiency calculation uses the same value. Both numbers are printed in the paper, so choosing one introduces nothing from outside it, and results for both are reported below.
The structure table holds two finite-thickness films between glass and air, with the emissive layer at a constant 1.76:

The two models using the supplementary index differ only in the emissive-layer row, switched to wavelength-resolved data from the dispersion parameters:

Optical and Emitter Settings
The five models differ in only two places: the emissive-layer index and the Vertical Fraction.
| Model | Emissive-layer at 528 nm | Vertical Fraction | |
|---|---|---|---|
| Published orientation, index from the text | 1.760 | 0.28 | 0.72 |
| Recovered orientation, index from the text | 1.760 | 0.24655 | 0.753 |
| Pure horizontal dipole, index from the text | 1.760 | 0 | 1.00 |
| Published orientation, supplementary index | 1.68005 | 0.28 | 0.72 |
| Recovered orientation, supplementary index | 1.68005 | 0.2192 | 0.781 |
Everything else is shared:
| Setting | Value |
|---|---|
| Emission spectrum | Gaussian, peak 527.4 nm, FWHM 23.2 nm, over 490–570 nm |
| Dipole position and distribution | Relative position 0.5, Delta |
| Detector | Emission Intensity (one Propagation detector is also required; this case uses R) |
| Wavelength mode | Single, 528 nm |
| Angle mode | Sweep, 0°–89.5°, step 0.5° |
| Comparison quantity | The TM curve of Normalized Angular Distribution |
The emitter panel should show Custom orientation, the matching Vertical Fraction, relative position 0.5, and a Delta distribution:

The angle range must reach 89.5° to cover the whole substrate-mode region:

Vertical Fraction at 0 and 1 once each and combine them linearly by fraction, instead of rerunning every value.Simulation Results and Comparison with Figure 3a
The published figure:
The four published model curves correspond to horizontal-dipole ratios of 0.67, 0.72, 0.91, and 1.00. Entering each of them as a Vertical Fraction and running gives four curves that can be drawn on the same axis as the published ones:
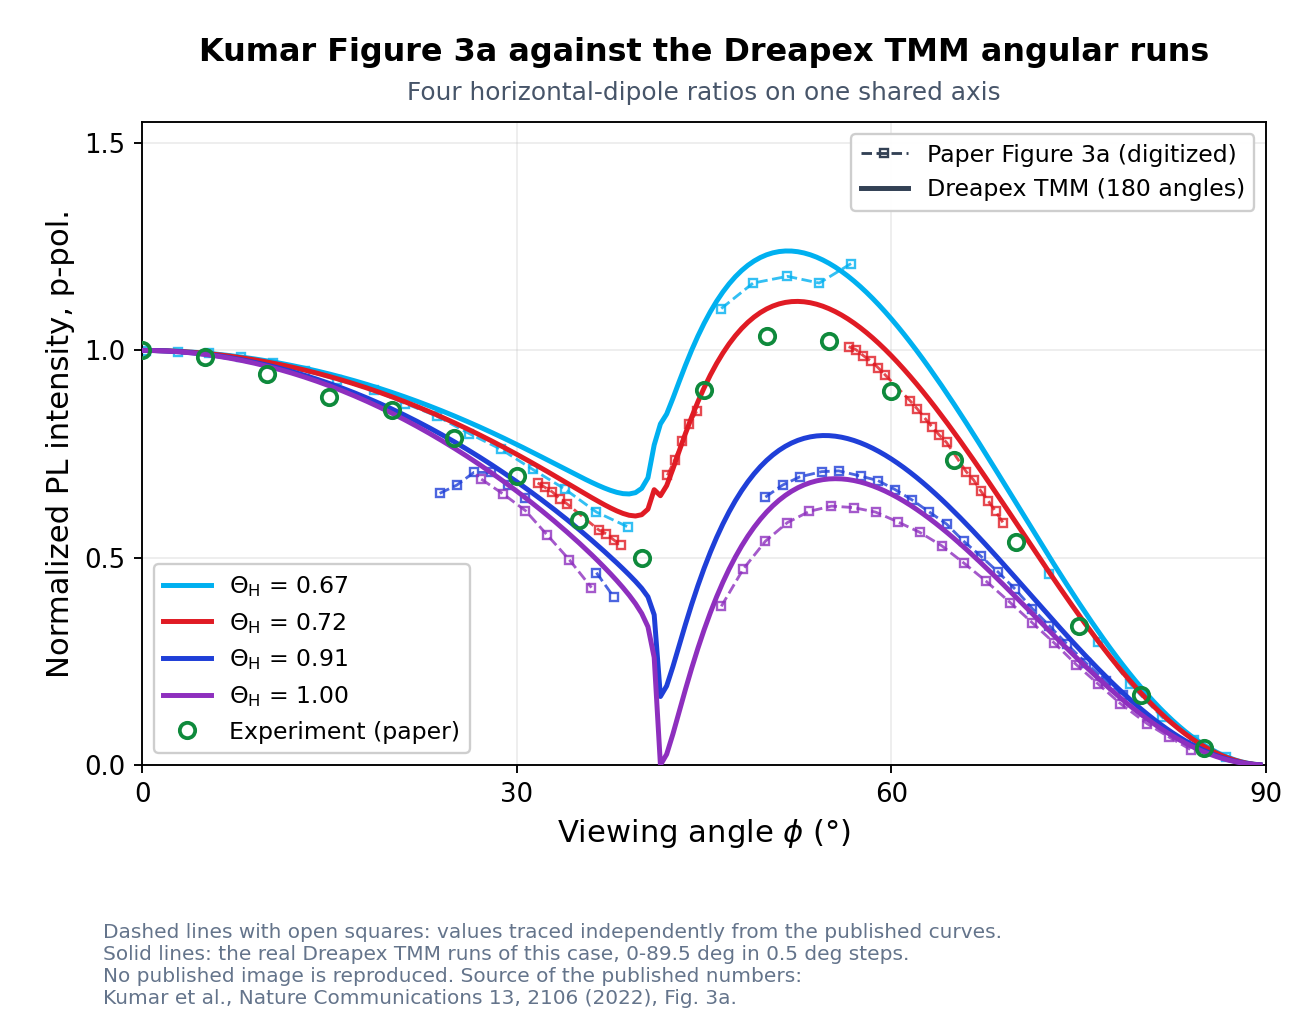
All four curves reproduce the published trend: the lower the orientation ratio, the shallower the minimum near 41° and the higher the substrate-mode peak near 52°.
| Horizontal-dipole ratio | RMS deviation from the same published curve |
|---|---|
0.67 | 0.038 |
0.72 | 0.087 |
0.91 | 0.080 |
1.00 | 0.072 |
The raw software results follow.
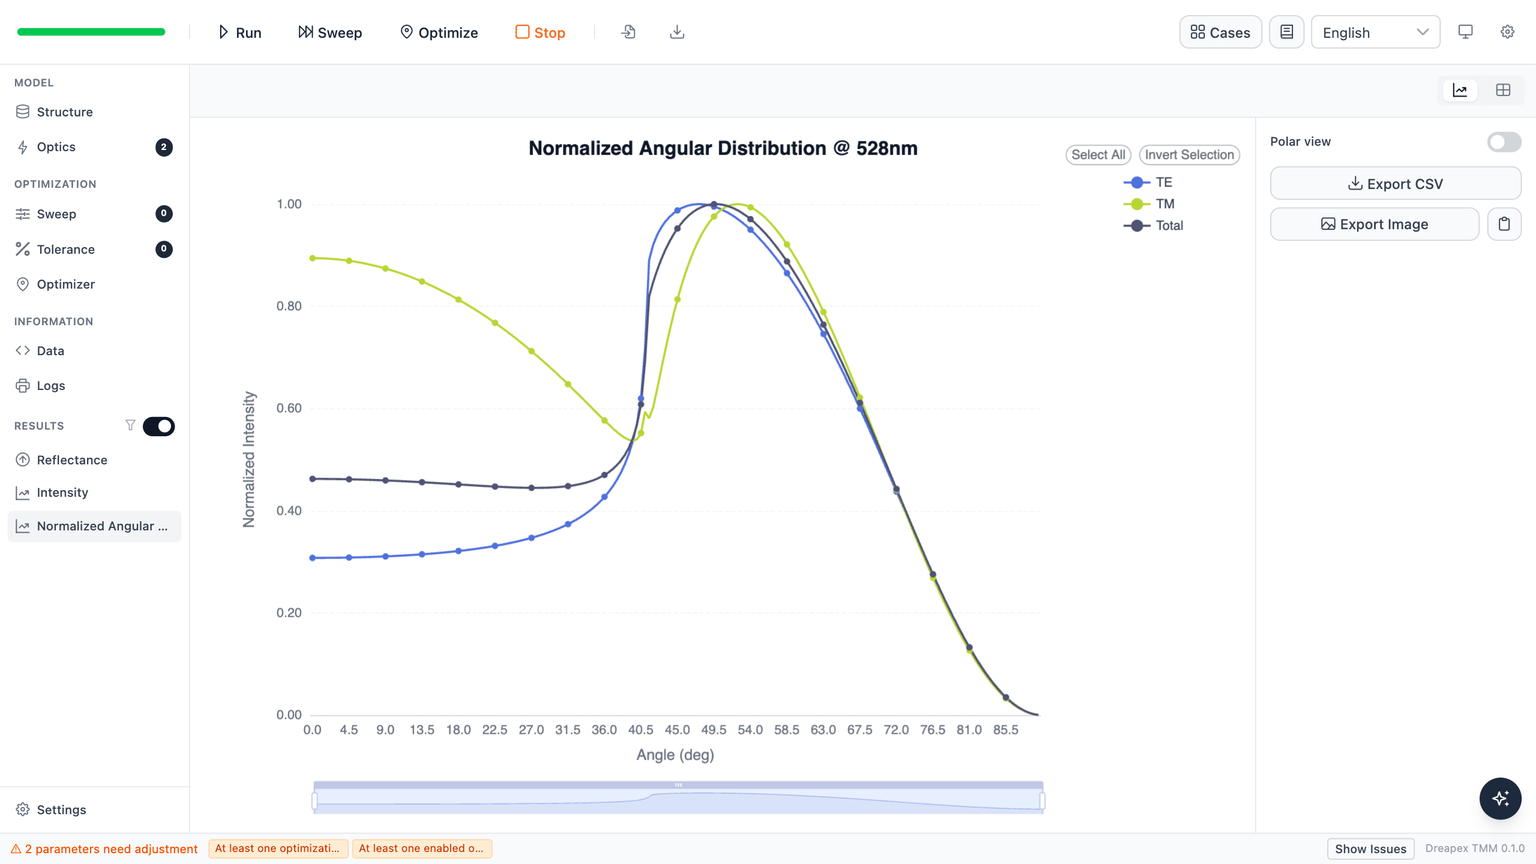
Entering the published orientation directly
Converting 0.72 into a Vertical Fraction of 0.28 and running once gives a minimum of 0.601 at 39.5° and a substrate-mode peak of 1.118 at 52.5°:
Releasing the orientation and fitting the 18 measured points by least squares gives 0.753 (1σ interval 0.746–0.761), with the minimum moving to 0.547 at 41.5° and the peak to 1.047 at 53.0°:
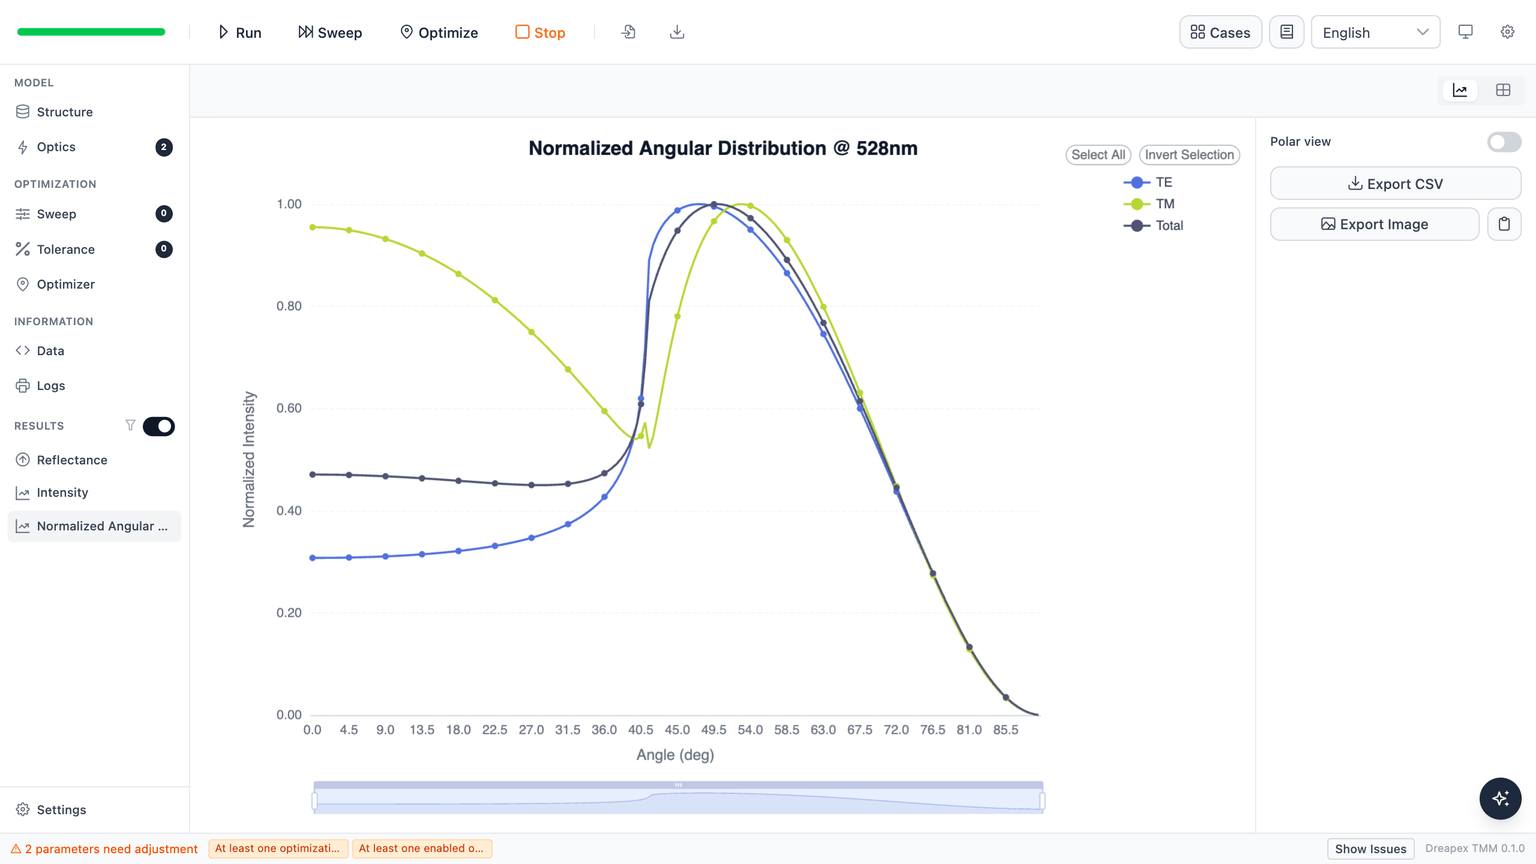
The recovered value is +0.033 from the published 0.72, and the all-angle RMS difference falls from 5.25 % to 3.57 %.
Pure horizontal dipole, with zero free parameters
Setting Vertical Fraction to 0 gives the pure horizontal-dipole curve, with no free parameters, corresponding to the curve of paper Figure 3a:
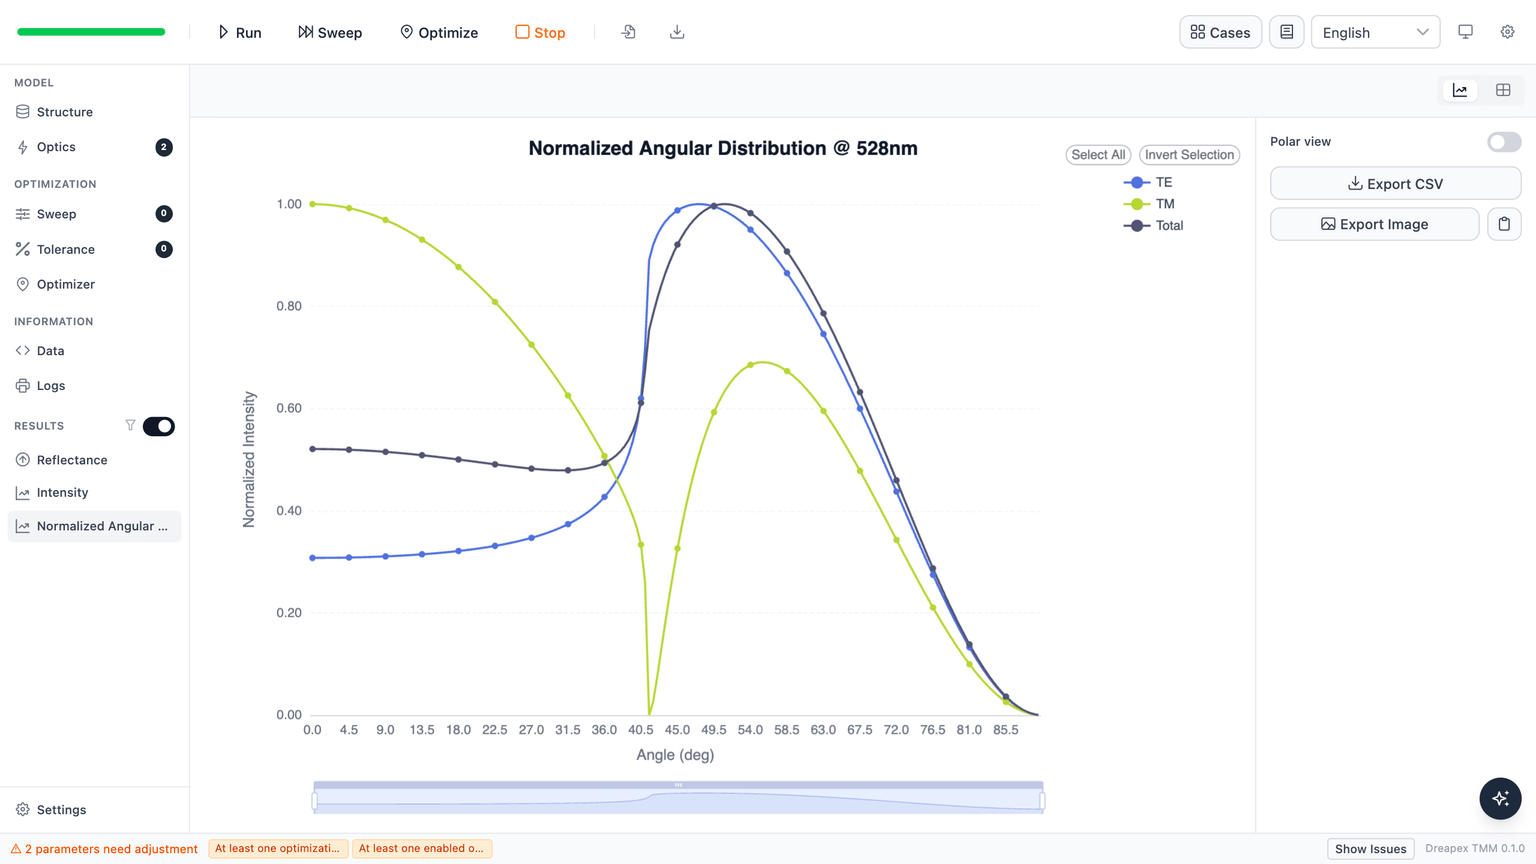
The model zero lands at 41.5° against the paper's 41.9°, both above the theoretical critical angle of 41.14°; the offset comes from the propagation phase over the 15 nm from the dipole to the top film surface. The peak of 0.691 is at 55.5°, and the RMS difference from the paper's own curve over 28°–84° is 4.68 %.
Switching to the supplementary index
Changing the emissive-layer index to the extrapolated 1.68005 with everything else fixed raises the minimum to 0.636 at 39.0° and the peak to 1.201 at 51.5°:
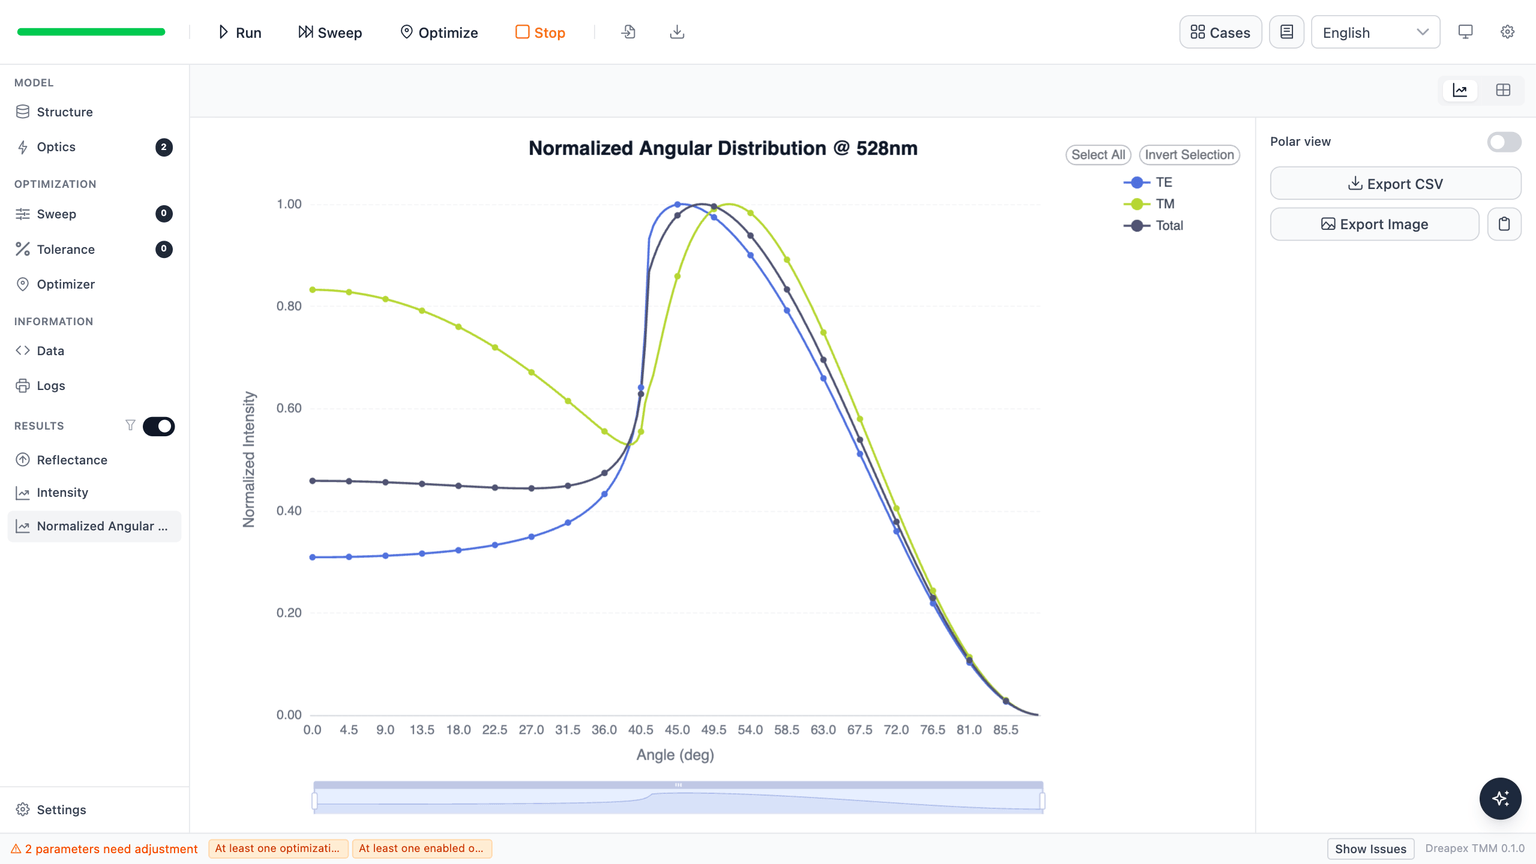
Releasing the orientation recovers 0.781, at which the curve itself matches the measured points well:
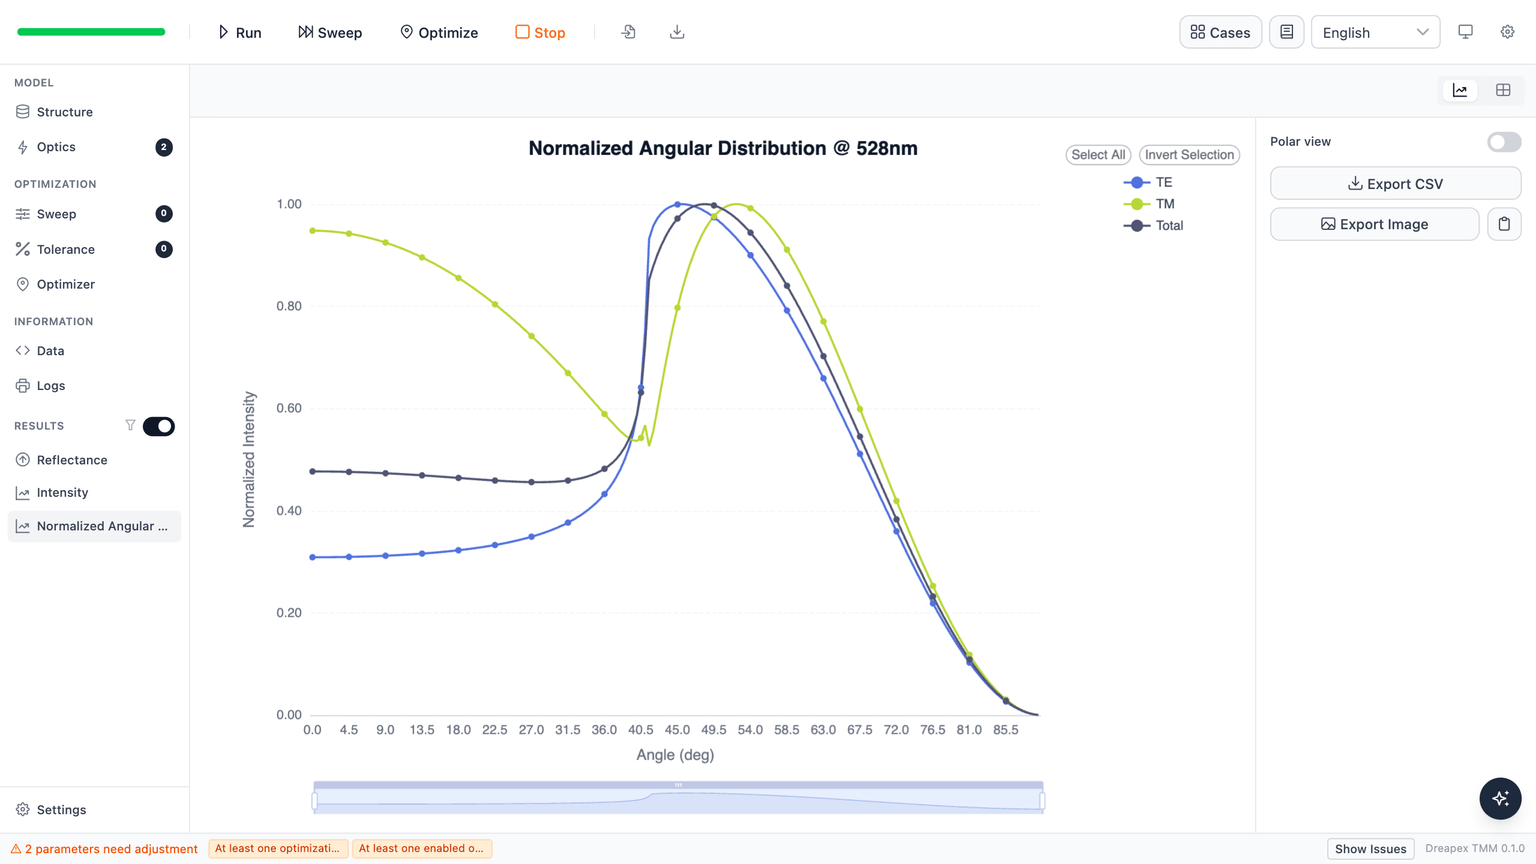
Characteristic values for all five models. The reference values are: measured minimum 0.498 at 40° and substrate-mode peak 1.034 at 50°; the paper's own curve has a minimum of 0.523 at 38.7° and a peak of 1.061 at 51.9°.
| Model | Minimum near 41° | Substrate-mode peak | RMS vs. the 18 measured points |
|---|---|---|---|
| Published orientation, index from the text | 0.601 @ 39.5° | 1.118 @ 52.5° | 5.25 % |
| Recovered orientation, index from the text | 0.547 @ 41.5° | 1.047 @ 53.0° | 3.57 % |
| Pure horizontal dipole, index from the text | 0.000 @ 41.5° | 0.691 @ 55.5° | Not applicable |
| Published orientation, supplementary index | 0.636 @ 39.0° | 1.201 @ 51.5° | 8.32 % |
| Recovered orientation, supplementary index | 0.555 @ 41.5° | 1.055 @ 52.5° | 3.10 % |
All five models move in the same direction as the paper: the lower the orientation ratio, the shallower the minimum near 41° and the higher the substrate-mode peak.
Emissive-layer at 528 nm | Recovered | 1σ interval | Difference from 0.72 |
|---|---|---|---|
| 1.760 (ellipsometry value in the main text) | 0.753 | 0.746–0.761 | +0.033 |
| 1.680 (supplementary extrapolation) | 0.781 | 0.774–0.787 | +0.061 |
The recovered value is almost entirely set by the emissive-layer index: every 0.02 of index lowers the recovered orientation ratio by about 0.007. Every other input is a weak determinant — hole-transport thickness from 5 to 35 nm, emissive-layer thickness from 24 to 40 nm, in-layer dipole position from 0.3 to 0.7, and spectral integration instead of a single wavelength together move the recovered value by only about 0.02. Digitization is not the bottleneck either: a ±0.0036 uncertainty on a normalized point propagates to a 3σ bound of only ±0.002.
Deviation Notes
The paper gives two different values for the emissive-layer index, and that is the main source of residual difference. Pixel readings of the published dispersion curve give about 1.69–1.72 at 528 nm, between the two, but the paper provides no fit parameters for that curve. The measured band the paper itself quotes is .
Over the 52°–68° substrate-mode region, the paper-to-model intensity ratio is 0.918 for the horizontal channel and 0.887 for the vertical, so the vertical channel is 2.5 percentage points weaker. That asymmetry lets this model reproduce the same substrate-mode peak height with fewer vertical dipoles, which biases the recovered orientation ratio upward.
The hole-transport thickness of the photoluminescence sample is not stated separately, so the device value of 18 nm is used. The emissive-layer extinction coefficient is a constant recovered from the optical density with no wavelength dispersion, while 528 nm sits right against that material's absorption edge.