Optical Power Distribution in Graphene OLEDs
Synergetic electrode architecture for efficient graphene-based flexible organic light-emitting diodes
Authors: Jaeho Lee, Tae-Hee Han, Min-Ho Park, Dae Yool Jung, Jeongmin Seo, Hong-Kyu Seo, Hyunsu Cho, Eunhye Kim, Jin Chung, Sung-Yool Choi, Taek-Soo Kim, Tae-Woo Lee, and Seunghyup Yoo
Journal: Nature Communications 7, 11791 (2016) · Comparison target: Supplementary Table 2 and Table 5 · License: CC BY 4.0
Adding 55 nm of TiO₂ under the graphene anode lifts the light that reaches air from 31.5% to 43.4%. In the same stack, swapping the low-index hole-injection layer GraHIL for PEDOT:PSS pushes evanescent loss from 22.4% to 28.6%.
This case builds four models at 550 nm and reproduces both changes with the Emission Mode result, channel by channel against the paper's two supplementary tables.
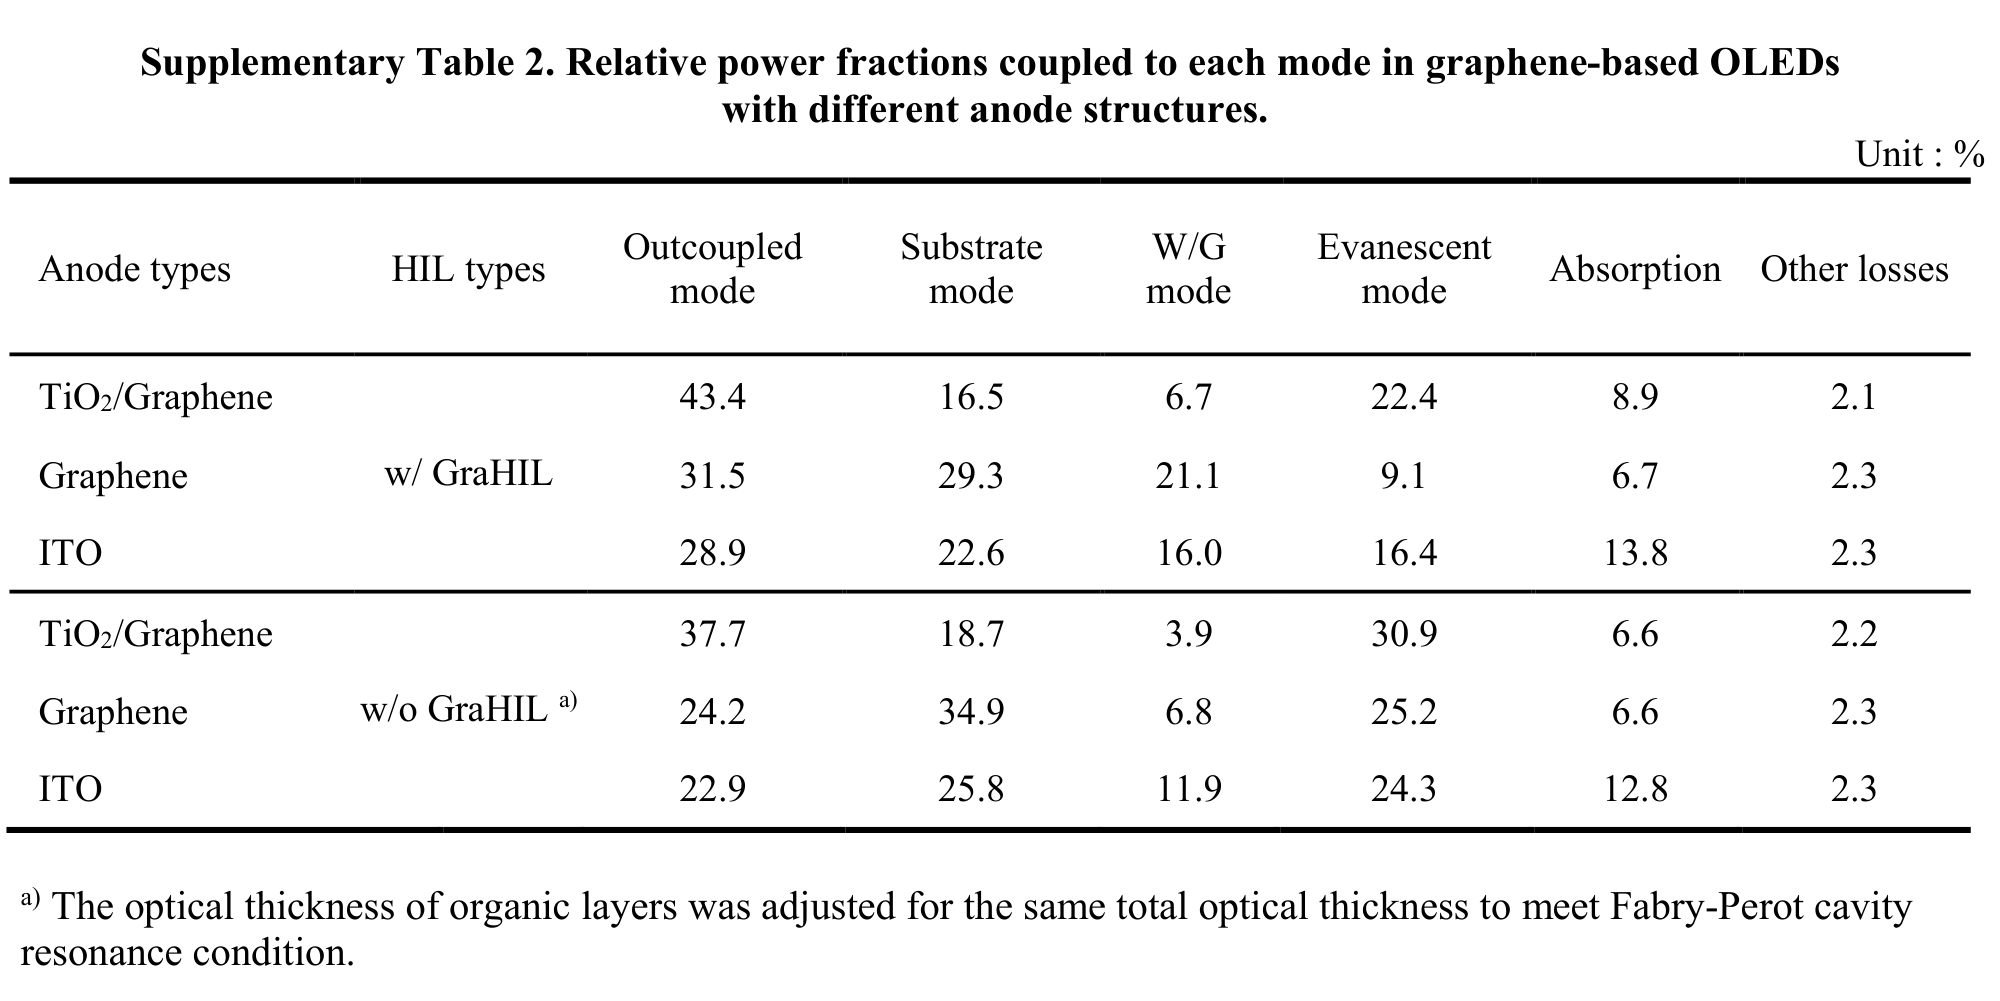
Every row closes to 100%. TiO₂/graphene/GraHIL has the highest air fraction, graphene/GraHIL the largest waveguide fraction, and ITO/GraHIL the largest absorption.
Background
In a bottom-emitting OLED the light generated by the emitter splits between air, the glass substrate, waveguide modes in the organic layers, and the evanescent field near the metal cathode. The paper places high-index TiO₂ under the graphene to push more light toward air with cavity resonance, and inserts low-index GraHIL between graphene and the organic stack to weaken evanescent loss at the cathode.
Structure
The paper's optical model merges every organic layer except the hole-injection layer into one equivalent uniform film, 90 nm thick for the TiO₂ device. This case follows that convention.
The primary stack runs from the glass outcoupling side to the Al cathode.
| Layer | Thickness | Optical constants at 550 nm | Source |
|---|---|---|---|
| Glass, incoherent | 1 mm | 1.52 | Thick substrate |
| TiO₂ | 55 nm | 2.50 | Optical constants published in the paper |
| Four-layer graphene | 1.36 nm | 2.60 + 1.30i | Graphene optical model cited by the paper; four sheets of 0.34 nm |
| GraHIL | 70 nm | 1.42 + 0.0013i | Optical constants published in the paper |
| Equivalent organic emitting layer | 90 nm | 1.80 | The paper's uniform-layer convention |
| LiF | 1 nm | 1.39 | Transparent-layer approximation at one wavelength |
| Al | 150 nm | 0.92 + 6.40i | Optical constants published in the paper; optically thick cathode |
Entered as above, the structure page should look like this. Check the 55/1.36/70/90/1/150 nm layer order, the incoherent flag on Glass, and the Emis. toggle on the equivalent organic layer.

The other three models change only the anode or the hole-injection layer; every remaining layer stays as entered.
| Model | Change from the primary stack | Question it answers |
|---|---|---|
| Graphene / GraHIL | Remove the 55 nm TiO₂ | What TiO₂ contributes to air outcoupling |
| ITO / GraHIL | Replace TiO₂ and graphene with 185 nm ITO, 1.90 + 0.02i | How the graphene anode differs from a conventional ITO anode |
| TiO₂ / graphene / PEDOT:PSS | Replace GraHIL with 50 nm PEDOT:PSS, 1.56 + 0.003i | What a low-index hole-injection layer does to evanescent loss |
The stack with TiO₂ removed:

TiO₂ and graphene together replaced by a single 185 nm ITO layer:

Only the 70 nm GraHIL replaced by 50 nm PEDOT:PSS, anode side untouched:

550 nm. This case uses 1.90 + 0.02i, a common value for transparent conducting oxides, so absorption and cavity phase in the ITO row carry more input uncertainty than the other three.Optical and Emitter Settings
All four models share the same emitter and detector settings; once the structure is built nothing else changes.
| Setting | Value |
|---|---|
| Emitter | Ir(ppy)₂acac |
| Spectrum | Unit White (no spectral weighting in a single-wavelength run) |
| Dipole orientation | Custom, vertical dipole fraction 0.23, i.e. about 77% horizontal |
| Depth distribution | Delta, 70 nm from the organic/Al interface |
| Relative position in the layer | 0.2222 measured from the outcoupling side |
| Intrinsic radiative quantum efficiency | 0.97 |
| Electron–hole balance | 1 |
| Detector | Mode, Single, 550 nm |
Filled in, the emitter panel looks like this. The 0.2222 relative position places the dipole plane 70 nm from the Al:

Enable Mode only, and set the wavelength mode to Single:

A single-wavelength run reads no broadband emission spectrum, so the Ir(ppy)₂acac EL curve does not need to be digitized. Run each of the four models once.
Optimize, go ahead and Run; they do not affect a fixed-parameter Mode calculation.Simulation Results and Comparison with Supplementary Tables 2 and 5
The Mode result reports seven channels, which map onto the paper's six as follows.
| Paper channel | Dreapex TMM channel | Note |
|---|---|---|
| Outcoupled / Air | Top Outcoupling | Same quantity |
| Substrate | Substrate | Same quantity |
| W/G (waveguide) | Waveguide | Same quantity |
| Evanescent | Evanescent | Same quantity |
| Absorption | Absorption | Same quantity |
| Other losses | Non-radiative | The paper merges non-radiative decay with residual terms; the software lists it separately |
| Not listed separately | Bottom Outcoupling | Near zero behind the thick Al cathode |
Anode structure: Supplementary Table 2
The published table:
The paper's values (grey bars) and this run (blue bars), drawn in the same channel order with shared axes across all four panels:
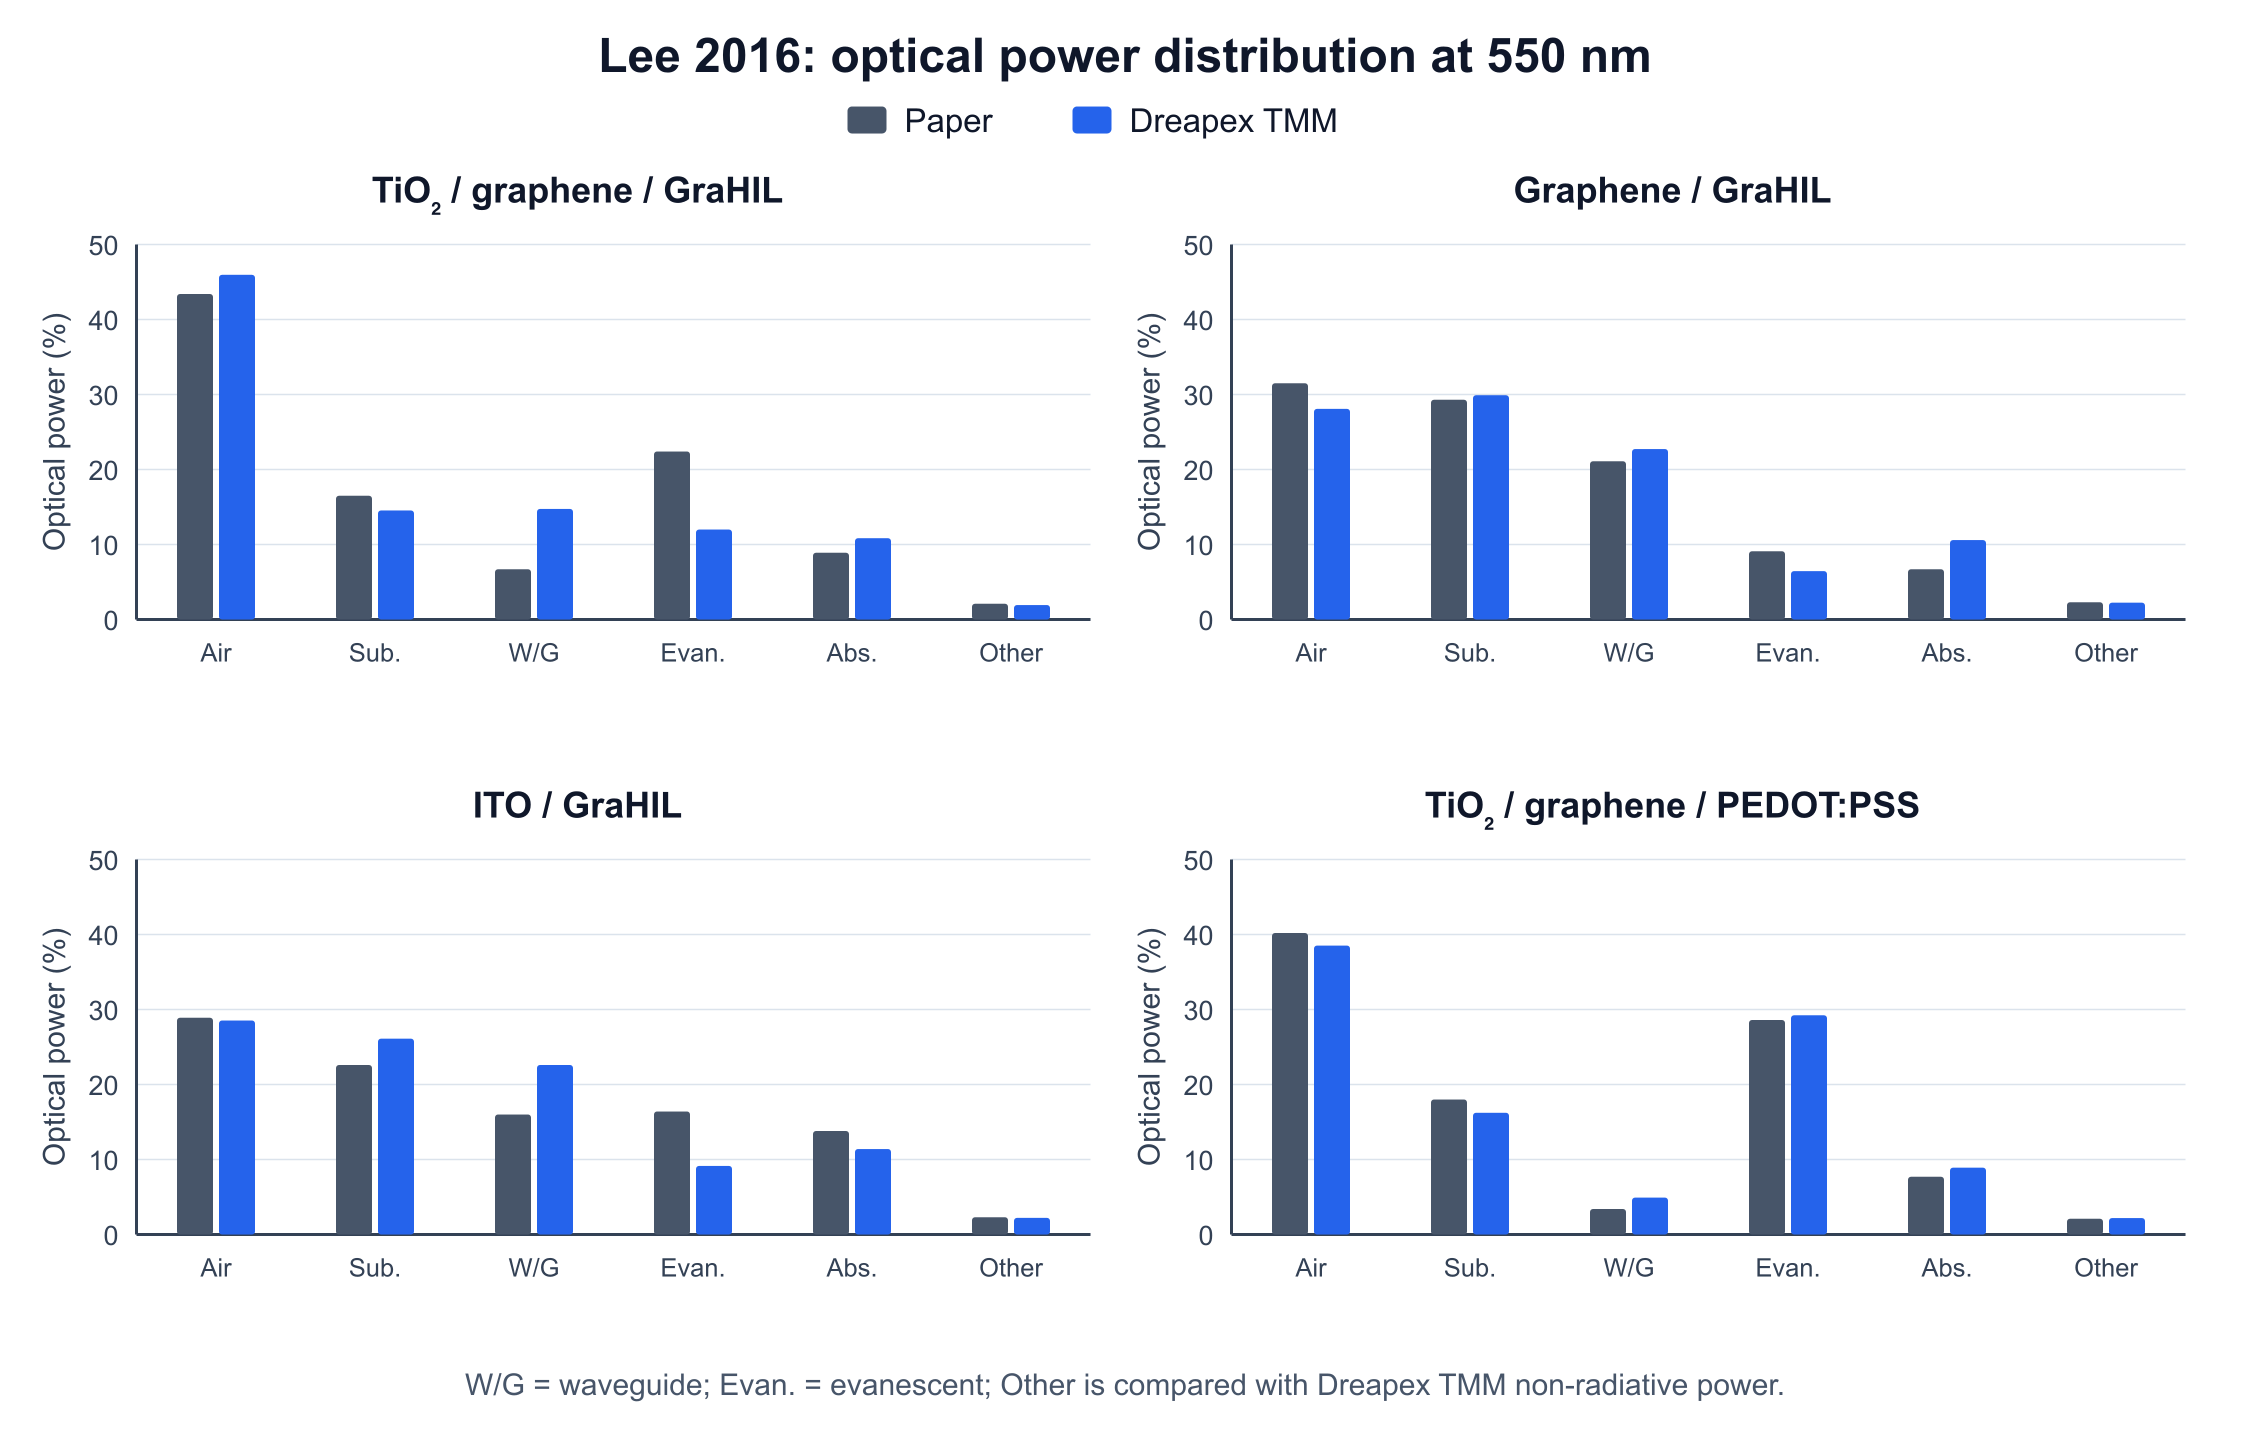
The bars track channel by channel. The key numbers for the three anodes:
| Model | Air: paper / Dreapex | Waveguide + evanescent: paper / Dreapex |
|---|---|---|
| TiO₂ / graphene / GraHIL | 43.4% / 45.96% | 29.10% / 26.74% |
| Graphene / GraHIL | 31.5% / 28.08% | 30.20% / 29.18% |
| ITO / GraHIL | 28.9% / 28.53% | 32.40% / 31.74% |
Adding TiO₂ gives the highest air fraction, removing it gives the highest waveguide fraction, and switching to ITO gives the largest absorption — the same ordering as the paper.
The three raw Mode results from the app follow, in the order of the table above. TiO₂/graphene/GraHIL:

With TiO₂ removed, the Top Outcoupling band narrows visibly:

With the ITO anode, absorption is the largest of the three:

Hole-injection layer: Supplementary Table 5
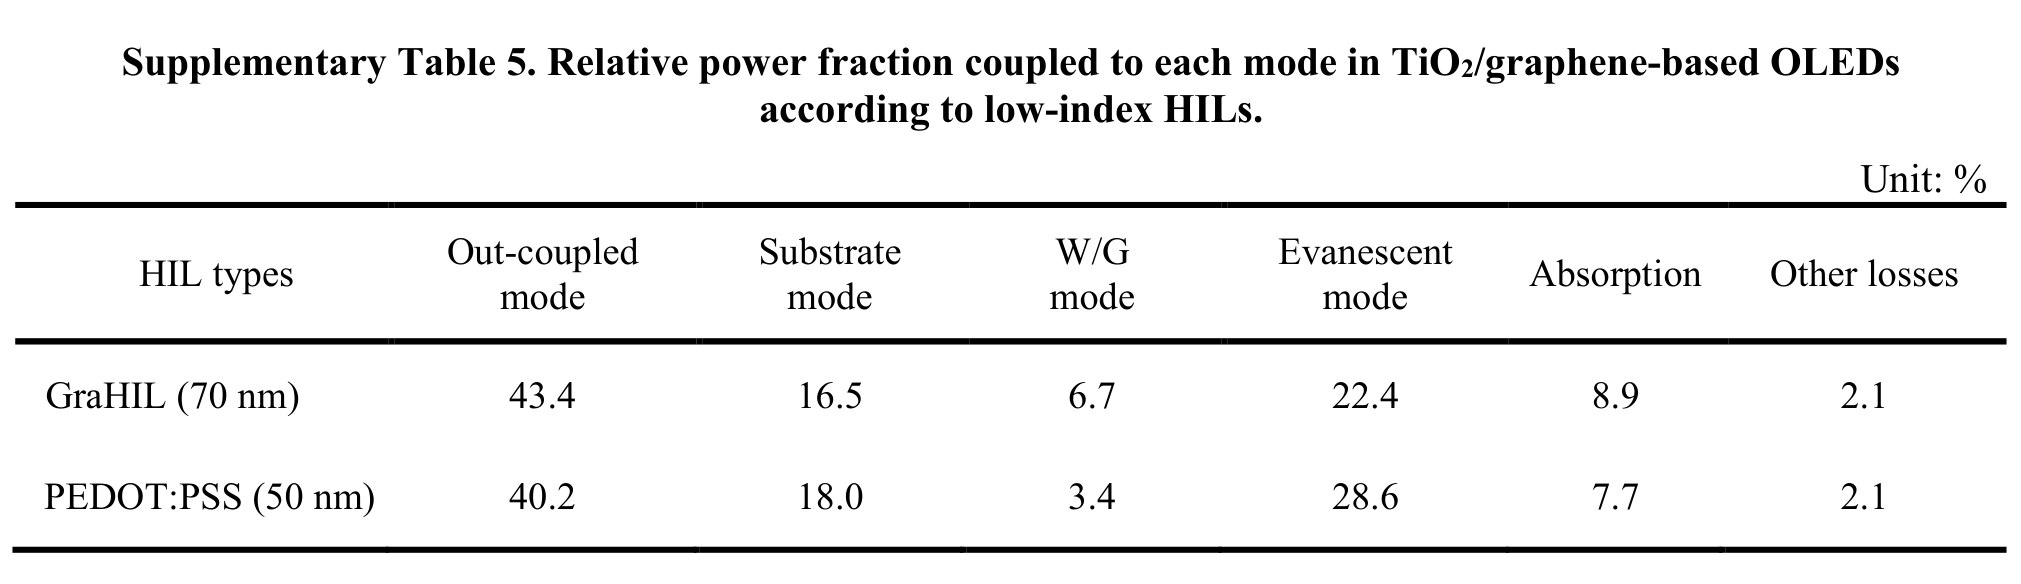
A separate table compares the two hole-injection layers:
The Mode result after switching to PEDOT:PSS, with a visibly wider evanescent band:
| Hole-injection layer | Air: paper / Dreapex | Evanescent: paper / Dreapex |
|---|---|---|
GraHIL, 70 nm | 43.4% / 45.96% | 22.4% / 11.99% |
PEDOT:PSS, 50 nm | 40.2% / 38.52% | 28.6% / 29.23% |

Switching to PEDOT:PSS raises evanescent loss and lowers air outcoupling, the same direction as the paper. The PEDOT:PSS row tracks channel by channel; the low evanescent value in the GraHIL row is explained below.
All four runs close to 100.0000% across seven channels, with Bottom Outcoupling below 0.000001% and Non-radiative between 1.93% and 2.24%, the same order as the paper's 2.1–2.3% other losses.
Deviation Notes
The paper publishes the optical constants of TiO₂, GraHIL, PEDOT:PSS, and Al only as curves, so reading single-wavelength values introduces error in cavity phase and absorption split. The ITO row additionally uses a proxy refractive index.
The clearest deviation is the boundary between the waveguide and evanescent channels. Both hold high in-plane-wavevector power; the software divides them by mode character and the paper by a different boundary. Summed, the two agree to within 0.66–2.36 percentage points; split apart, the individual gap grows to about 10 points.
The paper merges non-radiative decay and assorted residuals into one "other losses" entry, while the software lists Non-radiative and Bottom Outcoupling separately, so those two can only be compared by order of magnitude.