Cavity-Length Tuning and Angular Color Shift in Strong-Microcavity Top-Emitting OLEDs
Characterization of higher harmonic modes in Fabry–Pérot microcavity organic light emitting diodes
Authors: Ekraj Dahal, David Allemeier, Benjamin Isenhart, Karen Cianciulli, and Matthew S. White
Journal: Scientific Reports 11, 8456 (2021) · Comparison target: Figure 4
A top-emitting OLED can sweep its normal-direction peak across the entire visible range without changing the emitter, simply by making the organic stack thicker. Tilt the same device to 60° and the peak retreats tens of nanometres toward the blue.
This case builds three devices at the λ/2, λ, and 3λ/2 resonance orders, runs Intensity once, and reads the angle-resolved emission maps of paper Figure 4 together with the angular dispersion and quality factor.
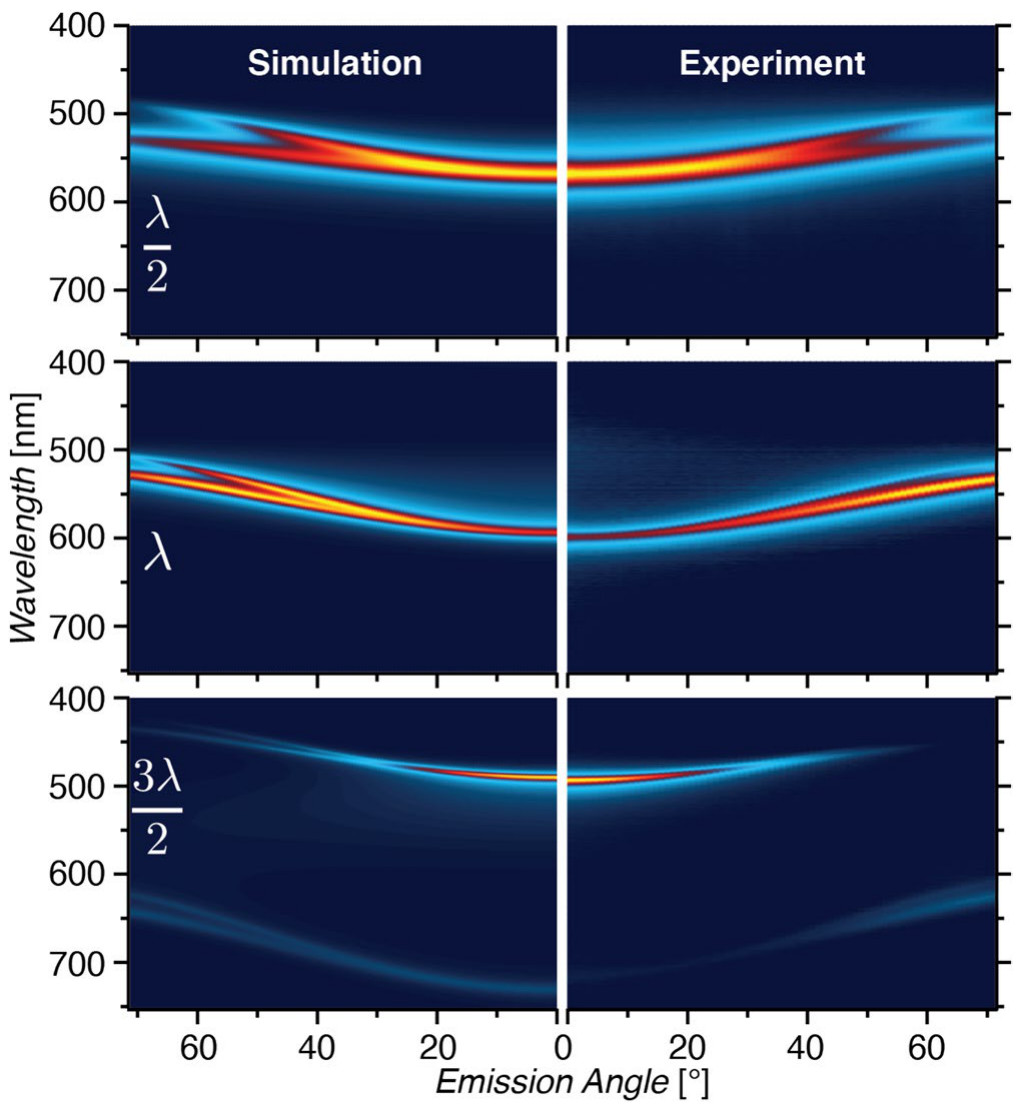
The three rows are the three resonance orders. Every bright band bends toward the blue with observation angle, and the λ/2 row splits into two branches beyond 40°.
Background
Both mirrors of a strong-microcavity device are metal: an opaque Ag bottom mirror and a semi-transparent Al top electrode. Only wavelengths that satisfy the round-trip phase condition build a standing wave and escape, so the resonance wavelength scales with the effective cavity length and inversely with the resonance order j. As the observation angle grows, propagation inside the cavity tilts away from the normal, the round-trip phase shortens, and the resonance moves toward the blue.
The quality factor Q is the peak wavelength divided by the full width at half maximum. Q of a Fabry–Pérot cavity grows roughly in proportion to the order, so dividing by j leaves a quantity set only by mirror loss, comparable across orders. The paper reports Q/j = 24.4 ± 3.3 for all its devices.
Structure
The three devices differ only in the NPB, Alq3, and BPhen thicknesses; both metal mirrors and both injection layers are identical. Rows run from the outcoupling side to the substrate side.
| Layer | λ/2 device | λ device | 3λ/2 device |
|---|---|---|---|
| Al semi-transparent top electrode | 30 nm | 30 nm | 30 nm |
| LiF | 1 nm | 1 nm | 1 nm |
| BPhen | 60 nm | 147 nm | 192 nm |
| Alq3 emissive layer | 20 nm | 40 nm | 40 nm |
| NPB | 39 nm | 102 nm | 133 nm |
| MoOx | 1 nm | 1 nm | 1 nm |
| Ag bottom mirror | 100 nm | 100 nm | 100 nm |
| Total organic thickness | 119 nm | 289 nm | 365 nm |
| Resonance order j | 1 | 2 | 3 |
The incidence medium is air and the transmission medium is a constant standing in for the Si wafer, since the 100 nm Ag already blocks the backward path. All refractive indices come from measured dispersion in the built-in material database, with no scaling.
The λ/2 device, 119 nm of organic material:

The λ device, all three layers thickened to 289 nm total:

The 3λ/2 device, 365 nm total:

Optical and Emitter Settings
Only the Alq3 layer is emissive, and the emitter settings are identical across the three devices.
| Setting | Value | Source |
|---|---|---|
| Emissive layer | Alq3, 20 nm in the λ/2 device and 40 nm in the λ and 3λ/2 devices | Supplementary Table S1 |
| Dipole distribution | Ten equally spaced dipole planes in the emissive layer, exponential exciton profile, diffusion length 3 nm, weight peaking at the hole-transport/emissive interface | Supplementary information |
| Dipole orientation | Horizontal to vertical 30:1, entered as a vertical fraction of 0.0323 | Supplementary information |
| Source spectrum | Alq3 photoluminescence from the built-in material database, 36 points, 435.9–785.4 nm, peak 539.2 nm | Substitute input; the paper states only a 526 nm peak |
| Detector | Emission Intensity | Counts only the far field emitted into the air above |
| Wavelength sampling | 440–780 nm, step 1 nm | — |
| Observation-angle sampling | 0–70°, step 2° | Covers the horizontal axis of paper Figure 4 |
The dipole-plane settings in the emissive layer:

30:1 ratio is entered as 1/31 ≈ 0.0323. Entering the reciprocal produces the opposite polarization behaviour.The wavelength and angle ranges for Intensity:

Both the angular dispersion and the quality factor are read from this single run; no additional detector is needed.
Simulation Results and Comparison with Figure 4
The published figure, with the authors' own simulation on the left and measurement on the right:
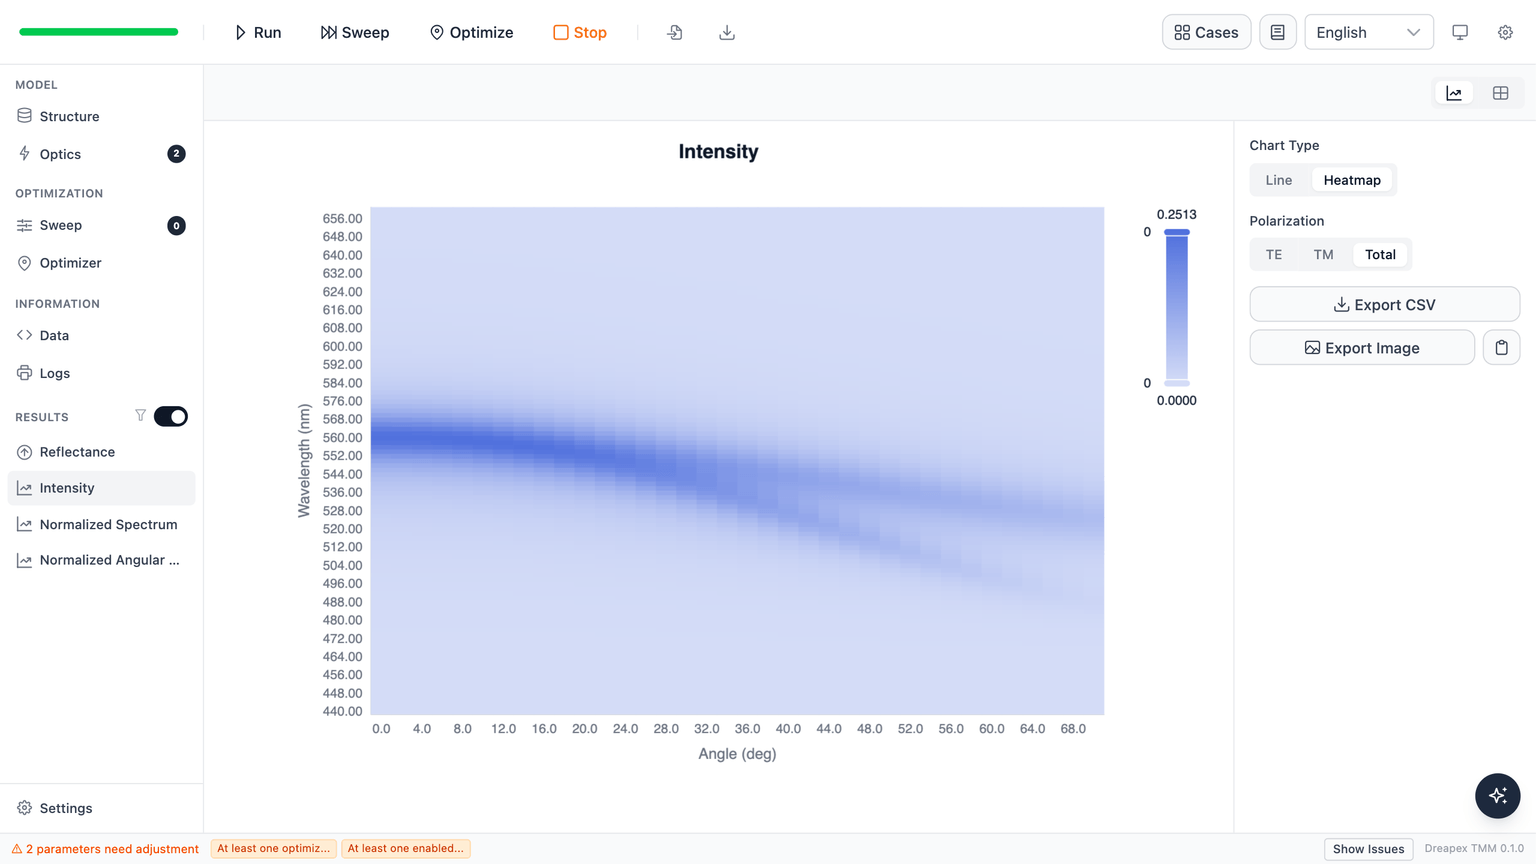
Switching the Intensity result to Heatmap gives the same chart type as the paper: observation angle across, wavelength up, and the bright band is the cavity resonance. The λ/2 device bends the most and splits into two branches beyond 40°:
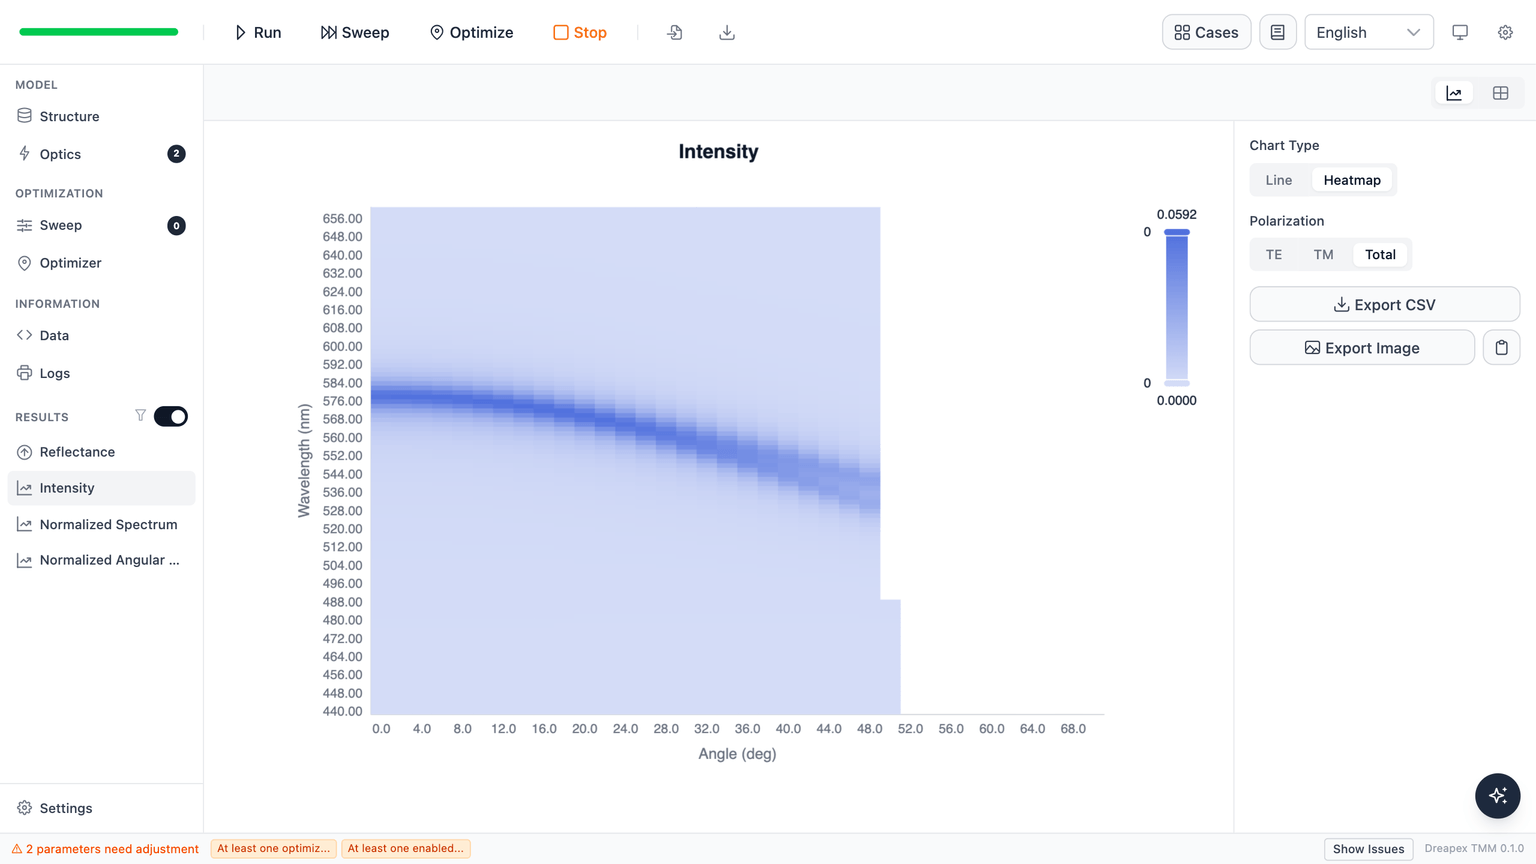
The λ device, with a narrower band:
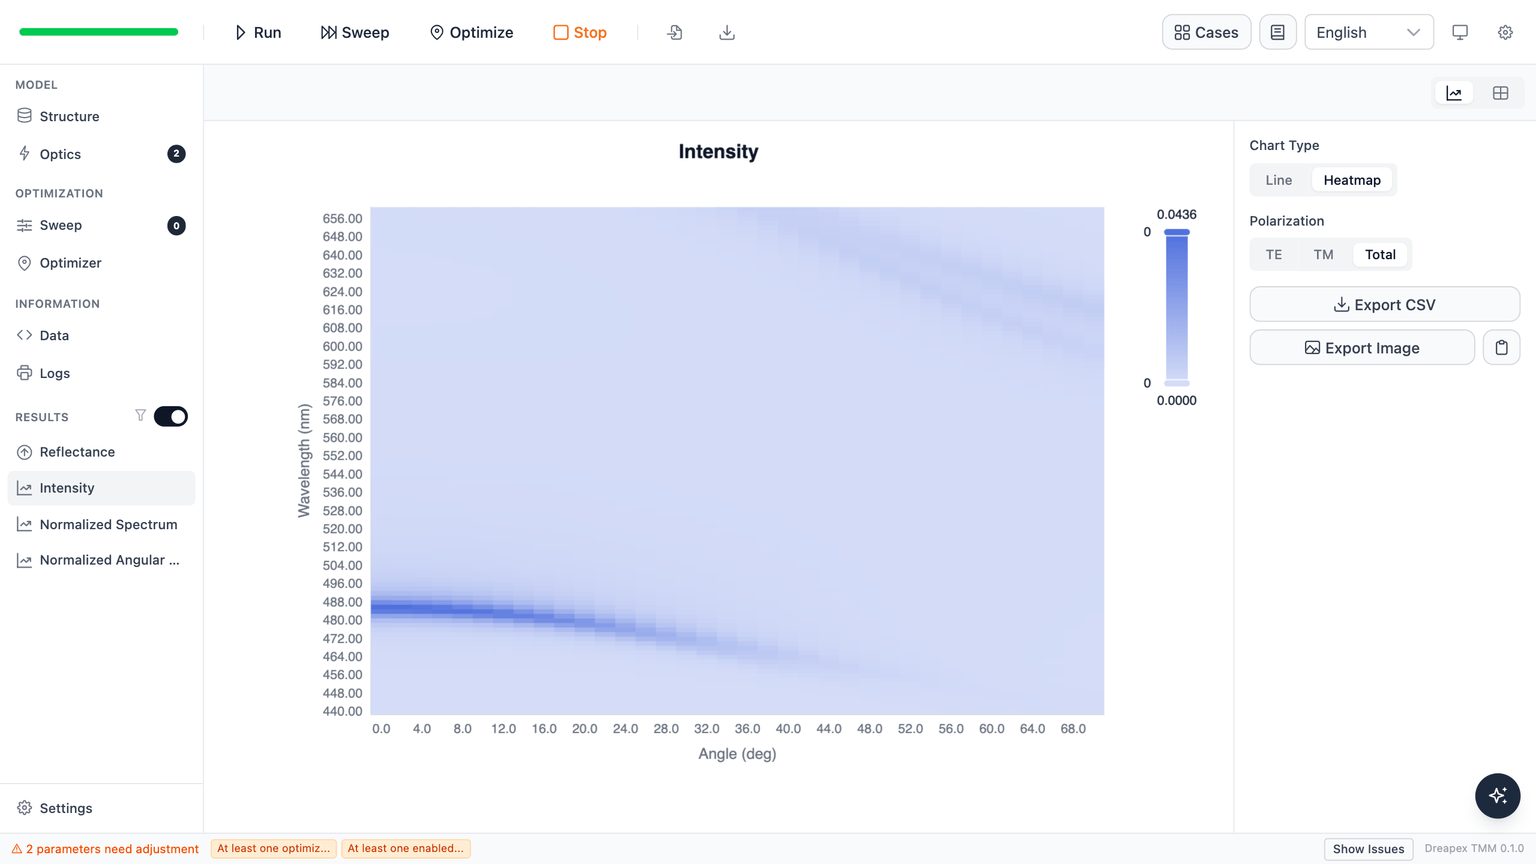
The 3λ/2 device, with the narrowest band and the least bending:
Angular dispersion shape
Subtracting each device's own normal-direction peak from its per-angle peak leaves a pure shape curve, which is then compared against column-by-column digitization of both panels of paper Figure 4.
| Device | RMS / maximum difference vs. the paper's simulation | RMS / maximum difference vs. the paper's measurement |
|---|---|---|
| λ/2 | 4.0 / 16.0 nm | 4.5 / 14.7 nm |
| λ | 4.2 / 12.3 nm | 2.1 / 4.6 nm |
| 3λ/2 | 4.1 / 8.2 nm | 2.3 / 4.6 nm |
The largest differences sit at 40–50°, where the s and p branches alternate as the global maximum. Total blue shift from 0 to 60°:
| Device | This run | Paper simulation | Paper measurement |
|---|---|---|---|
| λ/2 | 29.8 nm | 31.1 nm | 34.5 nm |
| λ | 49.9 nm | 54.0 nm | 54.4 nm |
| 3λ/2 | 37.1 nm | 45.3 nm | 39.4 nm |
All three datasets show that the blue shift is not monotonic in resonance order. Angular color shift is set jointly by the normal-direction peak and the effective index, so thickening a cavity to a higher order does not automatically buy a smaller shift.
Quality factor and linewidth compression
The quality factor comes from the peak and full width at half maximum of the normal-direction spectrum, covering all fifteen cavity thicknesses reported in the paper.
| Resonance order j | Devices | FWHM | Q | Q/j |
|---|---|---|---|---|
1 | 6 | 18.9–36.8 nm | 21–27 | 25.6 |
2 | 5 | 11.6–12.8 nm | 42–48 | 22.8 |
3 | 4 | 7.5–8.2 nm | 56–62 | 19.7 |
Across all devices Q/j is 23.1 ± 3.0 against the paper's 24.4 ± 3.3, a relative difference of 5.3% with overlapping 1σ intervals. The non-cavity reference device has an electroluminescence FWHM of about 100 nm; placing the same emitter in a strong microcavity compresses the emitted linewidth to 7.5–36.8 nm, more strongly at higher order.
s and p polarization splitting
At normal incidence the two polarizations are degenerate. As the angle grows, the p branch moves to the red of the s branch, forming the swallowtail shape described in the supplementary information.
| Quantity | 20° | 40° | 60° | 70° |
|---|---|---|---|---|
| λ/2 device splitting (p peak minus s peak) | +4.7 nm | +17.4 nm | +31.3 nm | +36.5 nm |
| λ device splitting | +2.3 nm | +8.3 nm | +15.2 nm | +17.5 nm |
| 3λ/2 device splitting | +1.6 nm | +5.6 nm | +8.3 nm | — |
| λ/2 device p-to-s peak intensity ratio | 0.99 | 1.17 | 2.61 | 5.91 |
All three qualitative claims reproduce: s and p are degenerate at normal incidence, the s peak always sits on the blue side, and p strengthens at large angles. The splitting shrinks with order, matching the supplementary figure where the λ/2 swallowtail is the most pronounced. The s branch of the 3λ/2 device at 70° is too weak to locate a stable peak.
Deviation Notes
The paper does not publish the NPB, Alq3, and BPhen dispersion it actually used, stating only for the organic layers inside its analytic model. Rerunning with a constant organic index of 1.80 brackets the offset:
| Device | This run (database dispersion) | Rerun with | Paper simulation |
|---|---|---|---|
| λ/2 | 560.2 nm | 574.9 nm | 567.5 nm |
| λ | 578.4 nm | 593.7 nm | 593.8 nm |
| 3λ/2 | 485.4 nm | 488.2 nm | 490.2 nm |
The index set the paper actually used lies between the two runs, so the absolute normal-direction peak carries a −15.4 to +7.4 nm systematic offset that cannot be narrowed further. The angular dispersion shape and Q/j compared above are both differential quantities and are unaffected.
Layer thicknesses come from Supplementary Table S1. The source spectrum peaks 13.2 nm to the red of the 526 nm the paper states; shifting the whole spectrum by −13.2 nm and rerunning moves the peaks by only −0.22 nm on average.
The supplementary information folds electron-transport-layer surface roughness (RMS 0–8 nm) into its scattering matrix, which this model has no counterpart for; the expected consequence is a slightly narrower line here than in the paper.