Dipole Orientation and Angle-Resolved Photoluminescence of TADF Doped Films
Aryl-Substituted Acridine Donor Derivatives Modulate the Transition Dipole Moment Orientation and Exciton Harvesting Properties of Donor–Acceptor TADF Emitters
Authors: Ettore Crovini, Kleitos Stavrou, Prakhar Sahay, et al. (corresponding authors Wolfgang Brütting, Andrew Monkman, and Eli Zysman-Colman)
Journal: The Journal of Physical Chemistry C 128, 14429 (2024) · Comparison target: Figure 6
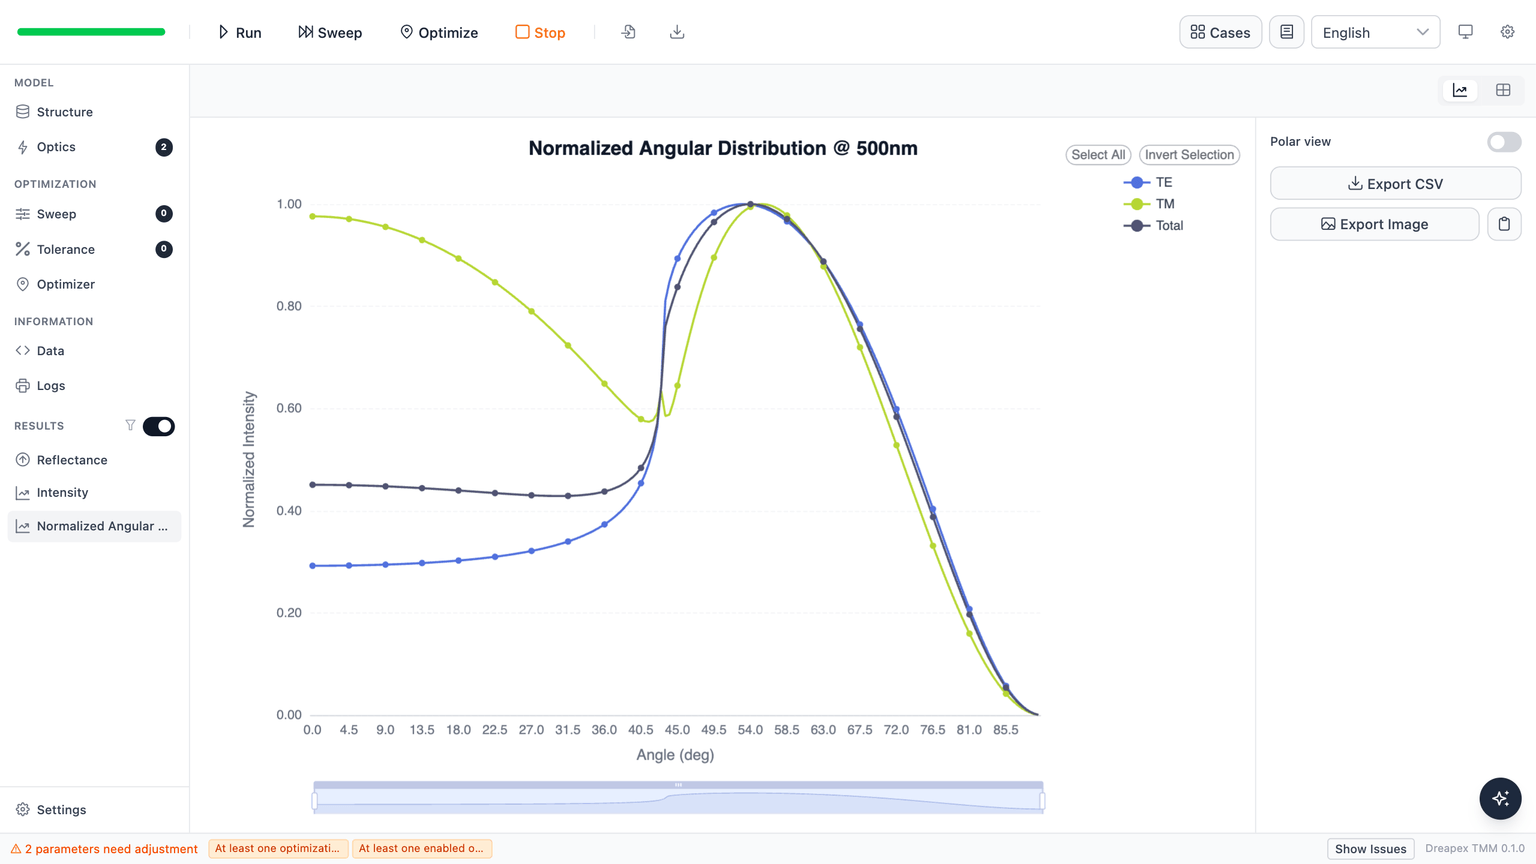
Swap one donor substituent on a TADF molecule and the main lobe of the p-polarized angle-resolved photoluminescence of the co-evaporated film rises from about 0.73 to about 0.95, corresponding to a vertical dipole fraction going from 0.15 to 0.26.
This case builds about the simplest model there is: one 35 nm doped film between fused silica and air. The five published orientations go in as given, with no fitting, and five angle sweeps reproduce the five curves of paper Figure 6.
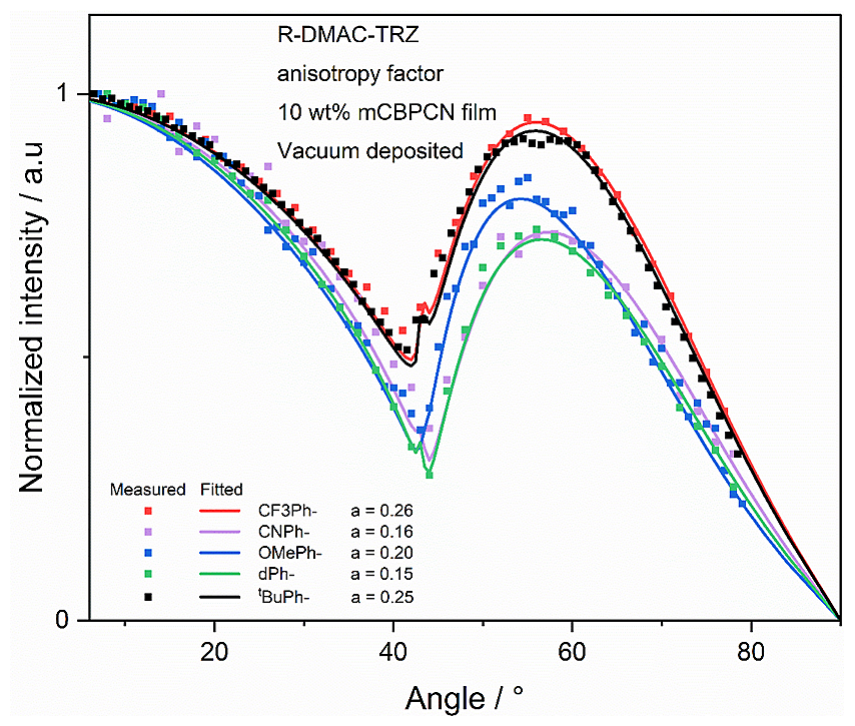
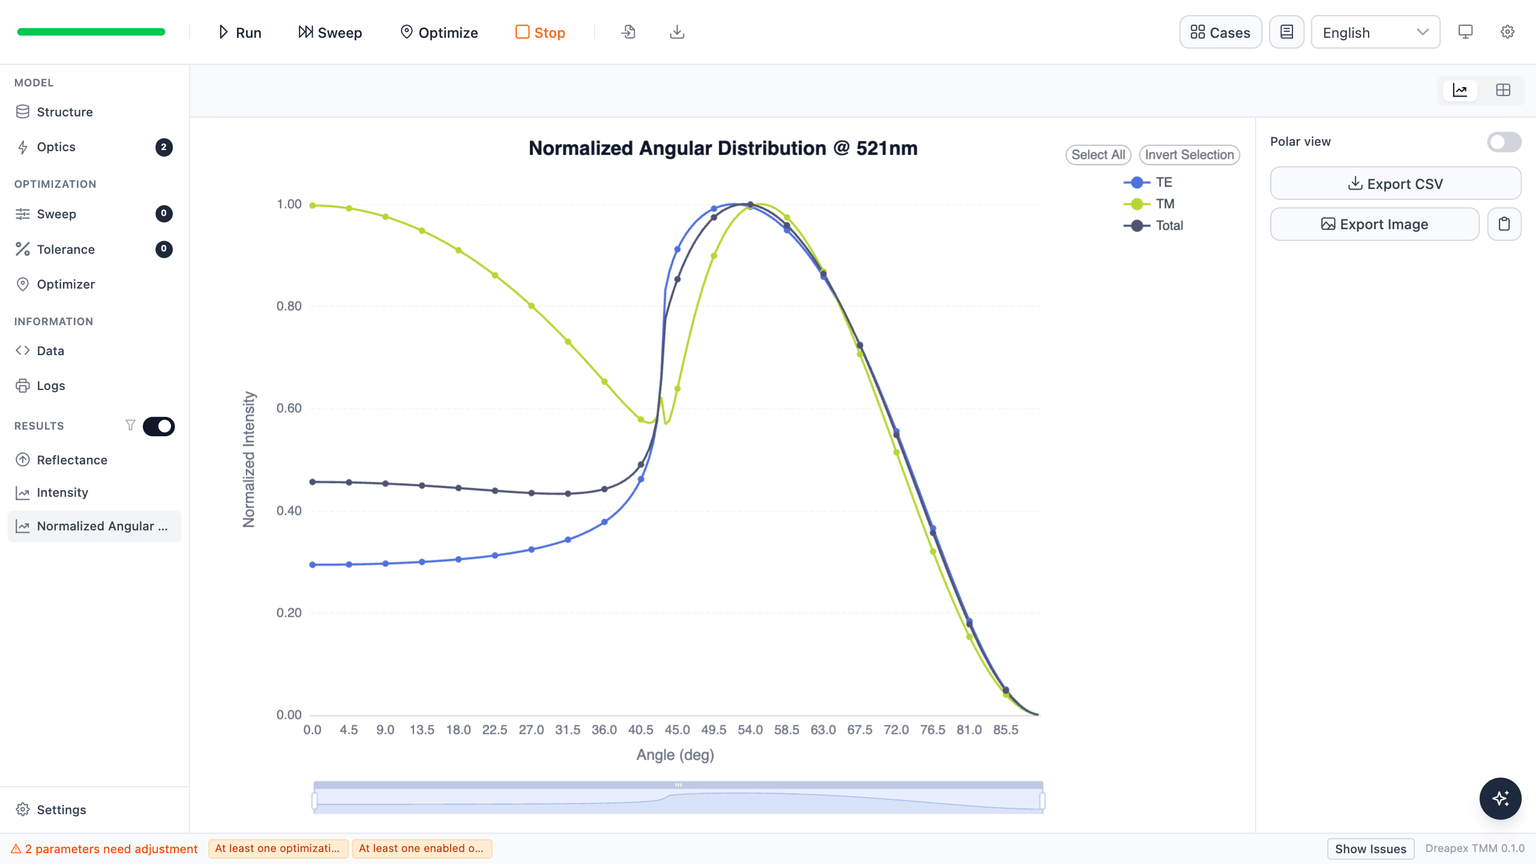
All five curves sit near the normalized peak around 0°, drop into a sharp minimum near 43°, form a main lobe at 55°–57°, and then fall monotonically to 90°. A taller main lobe means a larger vertical dipole fraction.
Background
Angle-resolved photoluminescence couples the doped film to a half-cylinder prism and records the s- and p-polarized emission intensity angle by angle on a rotation stage. Dipoles perpendicular to the film send energy to large angles and dipoles parallel to the film concentrate it at small angles, so the normalized p-polarized distribution can be inverted for the orientation.
The sharp minimum near 43° comes from total internal reflection at the film–air interface: the critical angle for fused silica at is about 43°, beyond which the air side becomes evanescent and the interference condition changes abruptly. All five curves kink at the same angle.
Vertical Fraction field, so the values go in unchanged. Entering by mistake degrades the all-angle RMS of the five curves from 2.46 %–4.68 % to 17.88 %–47.60 %.Structure
The samples are organic films co-evaporated on glass and index-matched to a fused-silica half-cylinder prism. The matching fluid removes the back-surface interface, and the half-cylinder lets emitted light cross the outer prism surface along the normal, so the stage reading equals the emission angle inside the prism and the detection side is treated as semi-infinite fused silica.
| Position | Material | Thickness | Optical input |
|---|---|---|---|
Incidence Medium (detection side) | Fused silica | Semi-infinite | , |
| Emissive layer | 10 wt% derivative co-evaporated in mCBPCN | 35 nm | Per-model values at each fitting wavelength, below |
Transmission Medium | Air | Semi-infinite | , |
The emissive layer takes the measured optical constants of the neat mCBP-CN host, ignoring the correction from 10 wt% doping. Each model needs only one pair of values, at its own fitting wavelength.
| Fitting wavelength | ||
|---|---|---|
490 nm | 1.7518 | 0.00353 |
500 nm | 1.7468 | 0.00329 |
520 nm | 1.7381 | 0.00289 |
521 nm | 1.7377 | 0.00287 |
539 nm | 1.7310 | 0.00260 |
The structure table holds a single finite-thickness film, bounded by fused silica and air:

35 nm is the only free structural parameter in this case, fixed by requiring one thickness to fit all five curves: fitting each curve independently gives scattered values of 28–39 nm, but the five confidence bands are simultaneously consistent only at 35 nm.Optical and Emitter Settings
Only three values differ between the five models: the emissive-layer and , and the emitter's Vertical Fraction.
| Model | Fitting wavelength | Vertical Fraction | Emissive-layer | Emissive-layer |
|---|---|---|---|---|
| dPh-DMAC-TRZ | 520 nm | 0.15 | 1.7381 | 0.00289 |
| CNPh-DMAC-TRZ | 490 nm | 0.16 | 1.7518 | 0.00353 |
| OMePh-DMAC-TRZ | 539 nm | 0.20 | 1.7310 | 0.00260 |
| tBuPh-DMAC-TRZ | 521 nm | 0.25 | 1.7377 | 0.00287 |
| CF3Ph-DMAC-TRZ | 500 nm | 0.26 | 1.7468 | 0.00329 |
Everything else is shared:
| Setting | Value |
|---|---|
| Spectrum type | Unit White |
| Dipole orientation | Custom, Vertical Fraction set to the published vertical fraction |
| Dipole position and distribution | Relative position 0.5, Delta |
| Detector | Intensity |
| Wavelength mode | Single, at each emitter's fitting wavelength |
| Angle mode | Sweep, 0°–89.5°, step 0.5° |
| Comparison quantity | The TM curve of Normalized Angular Distribution |
The emitter panel should show a Unit White spectrum, Custom orientation, the matching Vertical Fraction, relative position 0.5, and a Delta distribution:

Angles are defined inside the Incidence Medium, the same quantity as the paper's stage reading:

A single-wavelength comparison needs no measured photoluminescence spectrum: the normalized angular distribution is evaluated at a fixed wavelength, so the spectral amplitude cancels in the normalization.
Parallel and Perpendicular once each and combine them linearly by fraction, instead of rerunning every Custom value.Simulation Results and Comparison with Figure 6
The published figure, with squares for measurements and solid lines for the authors' own dipole-model fits:
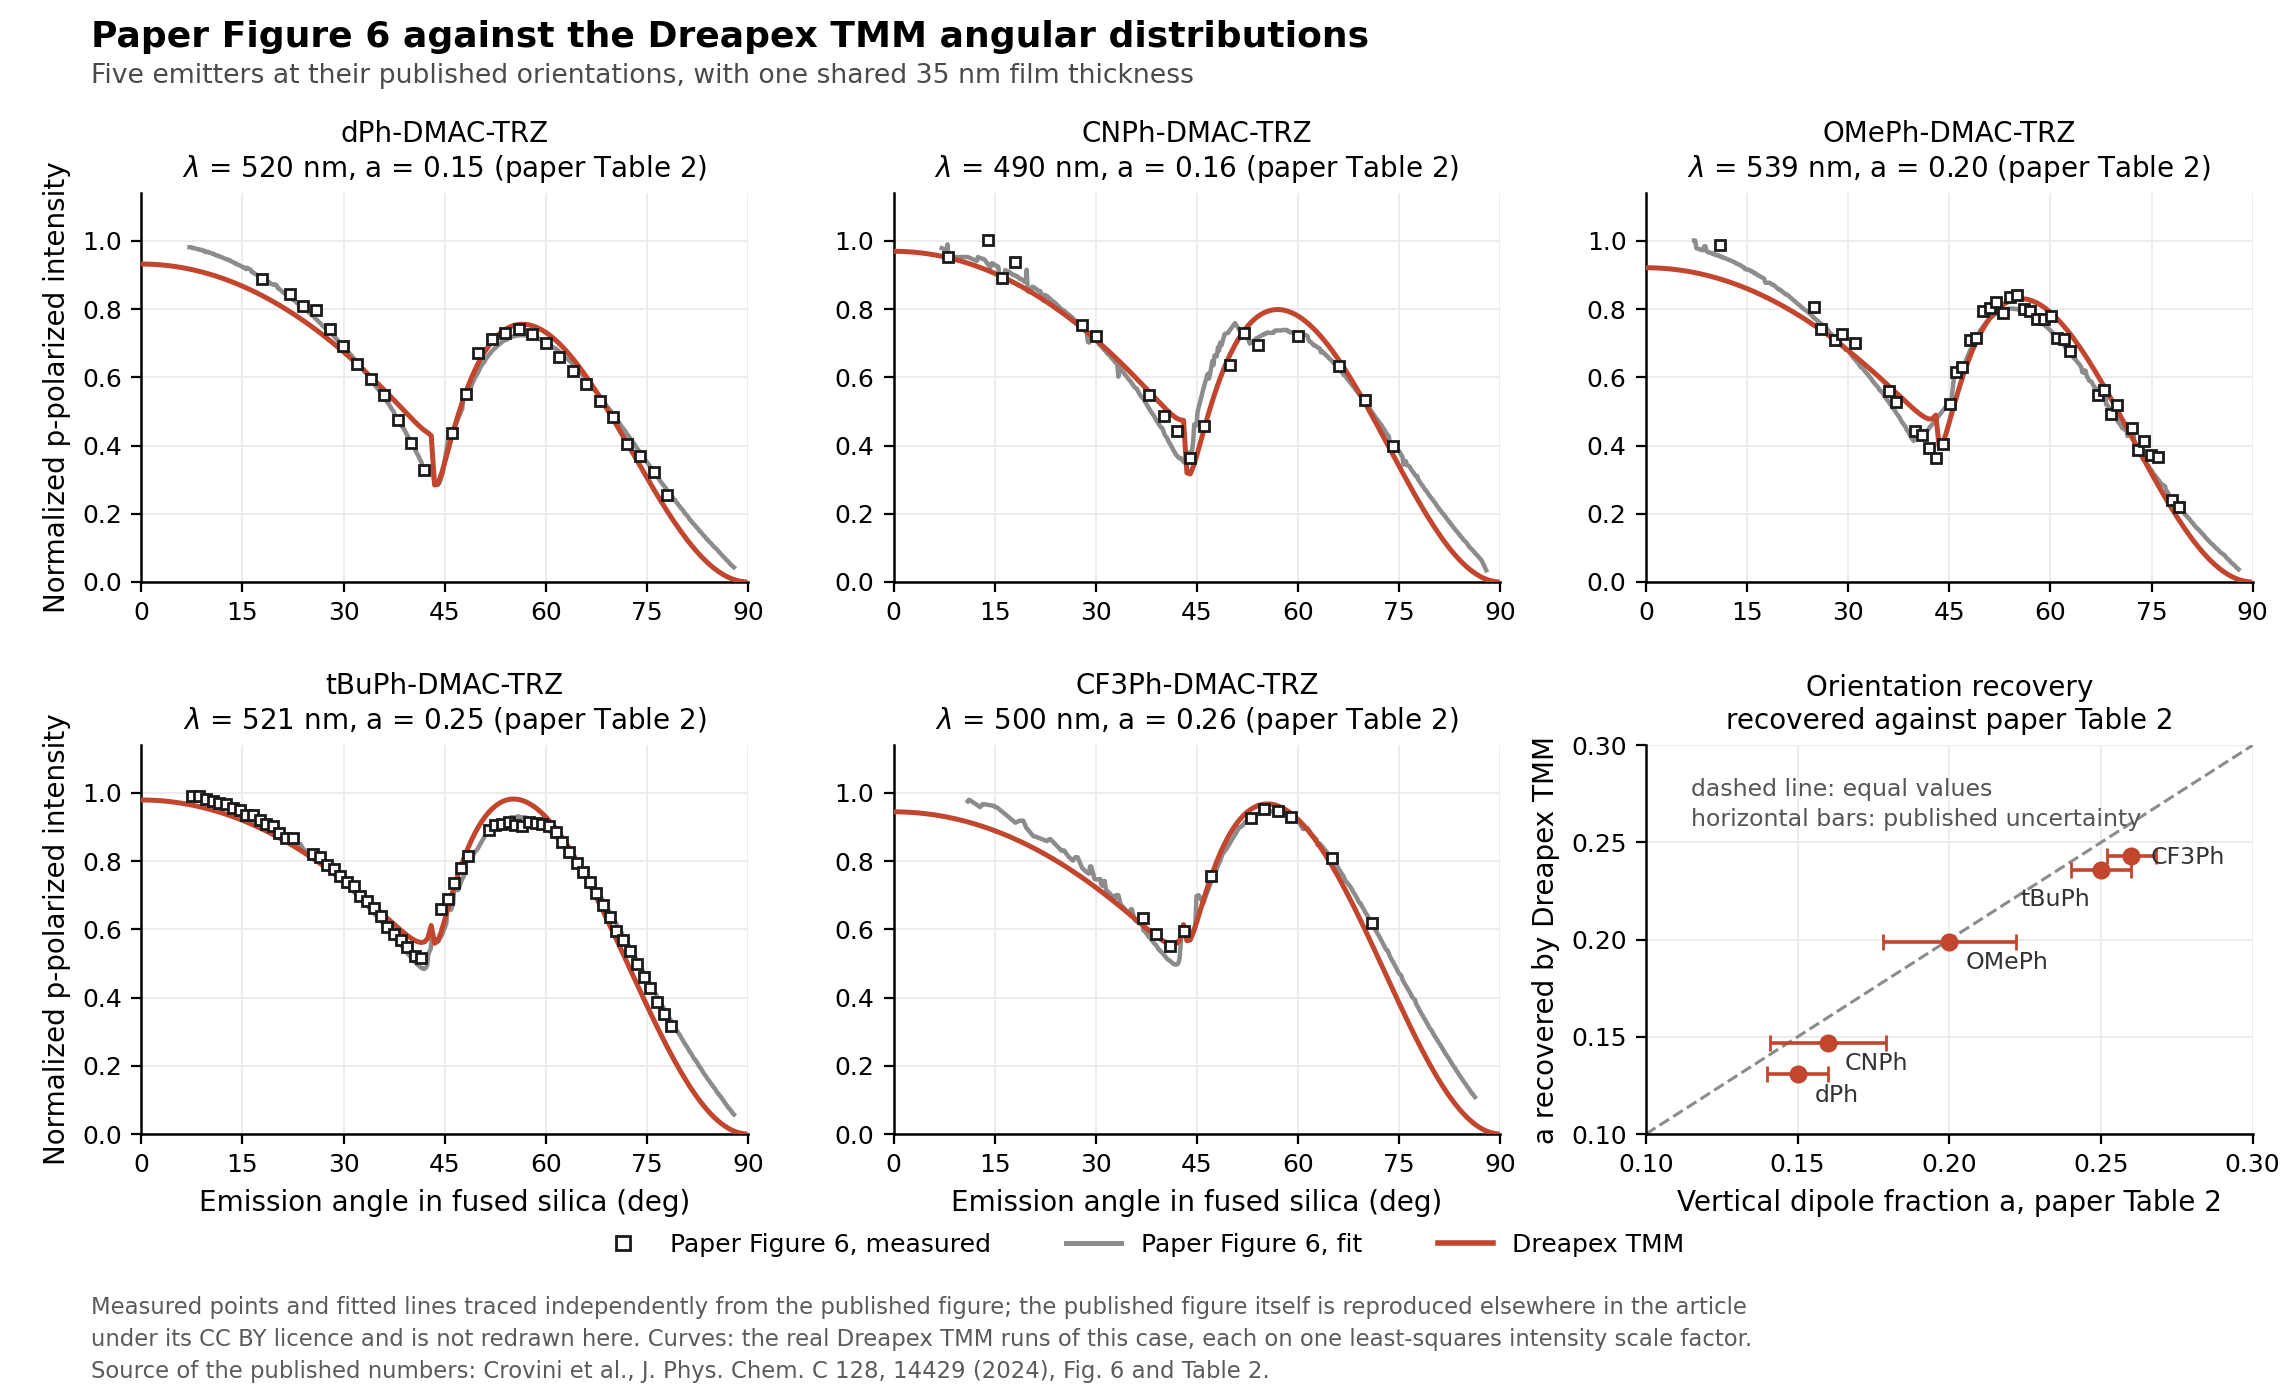
The five computed curves overlaid on the digitized measurements:
| Emitter | Fitting wavelength | Published vertical fraction | Digitized points | All-angle RMS |
|---|---|---|---|---|
| dPh-DMAC-TRZ | 520 nm | 0.15 ± 0.010 | 29 | 3.92 % |
| CNPh-DMAC-TRZ | 490 nm | 0.16 ± 0.019 | 18 | 3.99 % |
| OMePh-DMAC-TRZ | 539 nm | 0.20 ± 0.022 | 43 | 4.68 % |
| tBuPh-DMAC-TRZ | 521 nm | 0.25 ± 0.010 | 66 | 3.75 % |
| CF3Ph-DMAC-TRZ | 500 nm | 0.26 ± 0.008 | 11 | 2.46 % |
| All five combined | — | — | 167 | 3.83 % |
For reference, the measured squares scatter 1.46 % to 4.76 % around the paper's own fitted lines in the same figure — the same order as the model residual, and the digitization noise floor of Figure 6.
The five raw results from the app, ordered by increasing vertical fraction. dPh has the lowest orientation and the shortest main lobe:
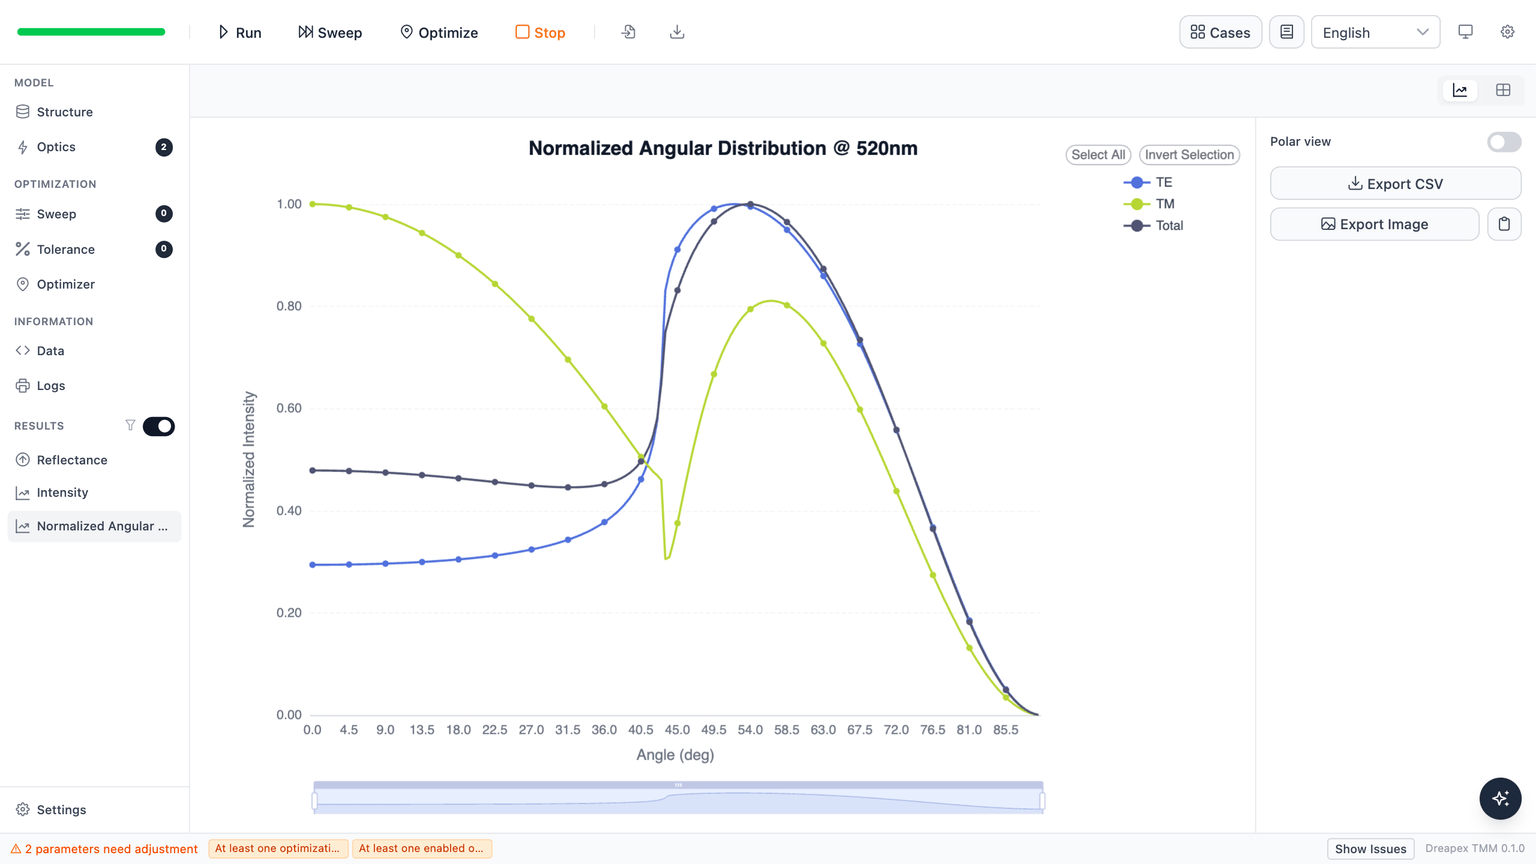
CNPh at 0.16:
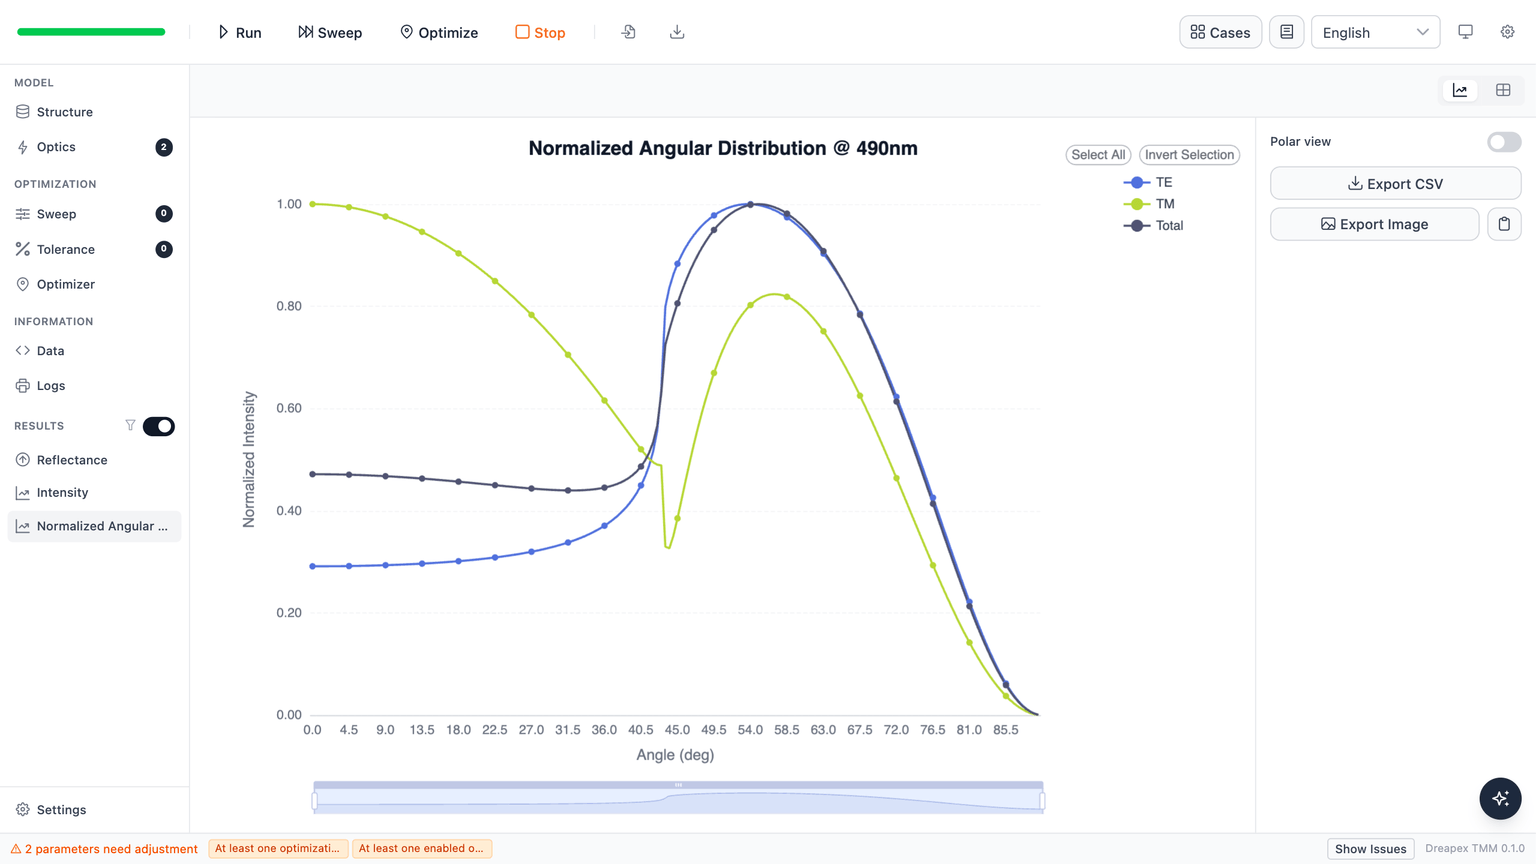
OMePh at 0.20:
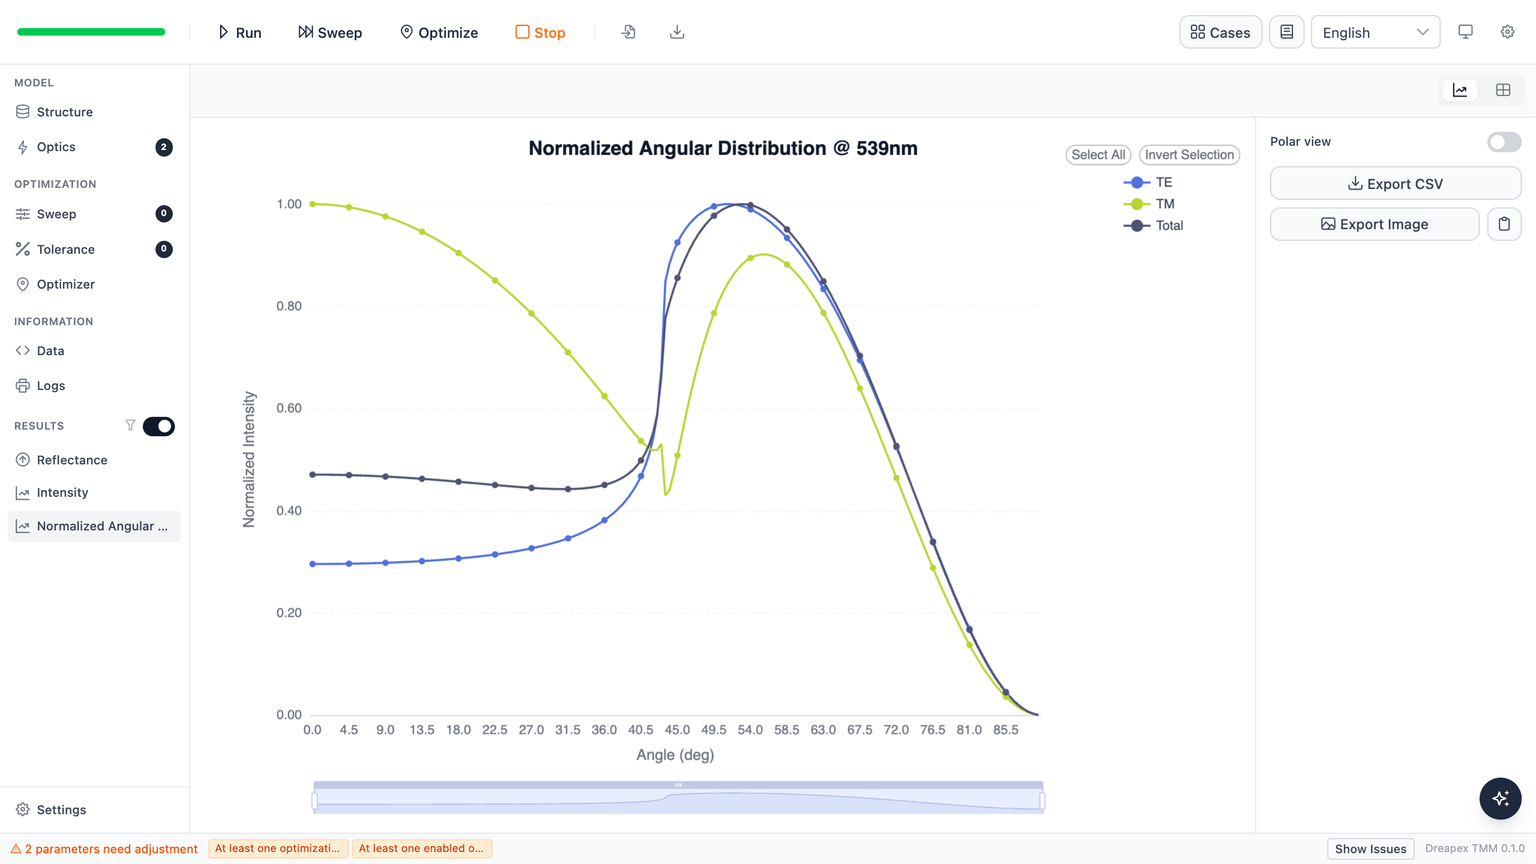
tBuPh at 0.25:
CF3Ph has the highest orientation and the tallest main lobe:
Recovering orientation from the curves
Releasing the orientation while keeping the shared 35 nm thickness and fitting each curve separately is how the paper extracts orientation in the first place.
| Emitter | Published | Recovered here | Difference | Published uncertainty | RMS after recovery |
|---|---|---|---|---|---|
| dPh-DMAC-TRZ | 0.15 | 0.131 | −0.019 | ±0.010 | 3.73 % |
| CNPh-DMAC-TRZ | 0.16 | 0.147 | −0.013 | ±0.019 | 3.79 % |
| OMePh-DMAC-TRZ | 0.20 | 0.199 | −0.001 | ±0.022 | 4.68 % |
| tBuPh-DMAC-TRZ | 0.25 | 0.236 | −0.014 | ±0.010 | 3.54 % |
| CF3Ph-DMAC-TRZ | 0.26 | 0.243 | −0.017 | ±0.008 | 2.31 % |
The ordering matches exactly: 0.131 < 0.147 < 0.199 < 0.236 < 0.243 against the published 0.15 < 0.16 < 0.20 < 0.25 < 0.26. The orientation span is 0.112 here and 0.110 in the paper.
All five differences share a sign, with a mean of −0.013, so this is a systematic downward shift. The confidence interval on a single curve is about ±0.02, so the workflow separates 0.15 from 0.26 but not 0.15 from 0.16.
Deviation Notes
Three inputs are not published, and together they account for the −0.013 systematic shift: the film thickness (taken as 35 nm, with no independent measurement to check against), the doped-film and (taken from the neat host, ignoring the 10 wt% doping correction), and the detection-medium index (fused silica at 1.4623 for 500 nm, with no model for residual mismatch between the matching fluid and the glass). Lowering that index from 1.4623 to 1.45 raises the recovered orientation by 0.017; replacing the point emission depth with a uniform in-layer distribution lowers it by 0.009.
The reference values come from independent digitization of Figure 6, not from numerical source data. The paper's own fitted lines are unreliable between 42° and 46° and above 75°, so the main comparison uses only the measured squares.